Immigrants from Cambodia vs Osage Unemployment Among Ages 30 to 34 years
COMPARE
Immigrants from Cambodia
Osage
Unemployment Among Ages 30 to 34 years
Unemployment Among Ages 30 to 34 years Comparison
Immigrants from Cambodia
Osage
5.7%
UNEMPLOYMENT AMONG AGES 30 TO 34 YEARS
5.8/ 100
METRIC RATING
215th/ 347
METRIC RANK
6.3%
UNEMPLOYMENT AMONG AGES 30 TO 34 YEARS
0.0/ 100
METRIC RATING
278th/ 347
METRIC RANK
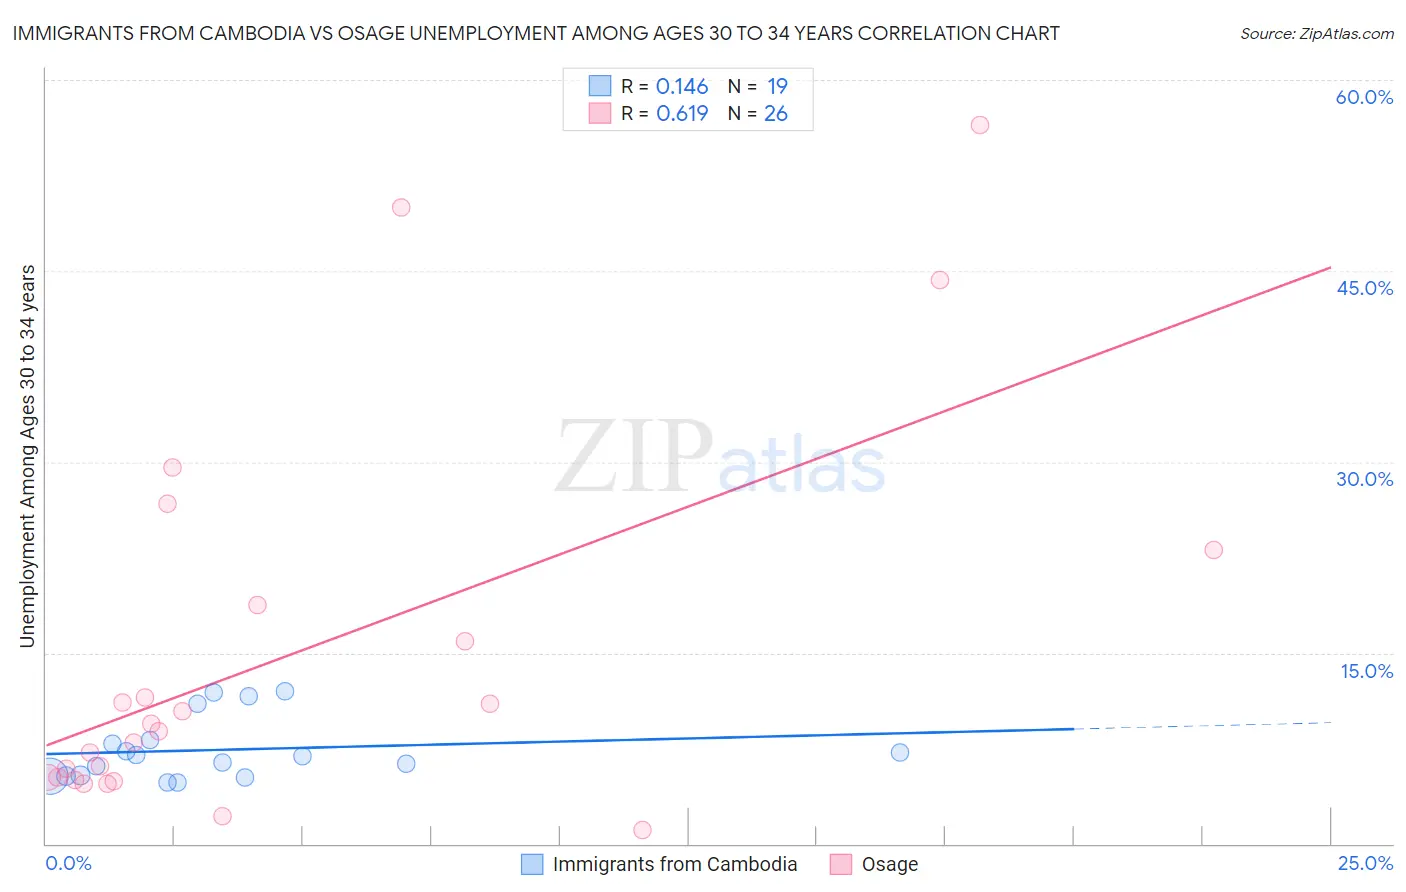
Immigrants from Cambodia vs Osage Unemployment Among Ages 30 to 34 years Correlation Chart
The statistical analysis conducted on geographies consisting of 200,562,885 people shows a poor positive correlation between the proportion of Immigrants from Cambodia and unemployment rate among population between the ages 30 and 34 in the United States with a correlation coefficient (R) of 0.146 and weighted average of 5.7%. Similarly, the statistical analysis conducted on geographies consisting of 89,714,543 people shows a significant positive correlation between the proportion of Osage and unemployment rate among population between the ages 30 and 34 in the United States with a correlation coefficient (R) of 0.619 and weighted average of 6.3%, a difference of 10.7%.
Unemployment Among Ages 30 to 34 years Correlation Summary
| Measurement | Immigrants from Cambodia | Osage |
| Minimum | 4.8% | 1.1% |
| Maximum | 12.0% | 56.5% |
| Range | 7.2% | 55.4% |
| Mean | 7.4% | 14.9% |
| Median | 6.9% | 9.1% |
| Interquartile 25% (IQ1) | 5.3% | 5.2% |
| Interquartile 75% (IQ3) | 8.1% | 18.8% |
| Interquartile Range (IQR) | 2.8% | 13.6% |
| Standard Deviation (Sample) | 2.5% | 15.0% |
| Standard Deviation (Population) | 2.4% | 14.7% |
Similar Demographics by Unemployment Among Ages 30 to 34 years
Demographics Similar to Immigrants from Cambodia by Unemployment Among Ages 30 to 34 years
In terms of unemployment among ages 30 to 34 years, the demographic groups most similar to Immigrants from Cambodia are Immigrants from Panama (5.7%, a difference of 0.010%), Immigrants from Syria (5.7%, a difference of 0.11%), Immigrants from Fiji (5.7%, a difference of 0.24%), Immigrants (5.7%, a difference of 0.35%), and Panamanian (5.8%, a difference of 0.46%).
| Demographics | Rating | Rank | Unemployment Among Ages 30 to 34 years |
| Immigrants | Philippines | 11.5 /100 | #208 | Poor 5.7% |
| French | 10.8 /100 | #209 | Poor 5.7% |
| Whites/Caucasians | 9.2 /100 | #210 | Tragic 5.7% |
| Spanish American Indians | 8.7 /100 | #211 | Tragic 5.7% |
| Scotch-Irish | 8.6 /100 | #212 | Tragic 5.7% |
| Immigrants | Immigrants | 7.1 /100 | #213 | Tragic 5.7% |
| Immigrants | Panama | 5.9 /100 | #214 | Tragic 5.7% |
| Immigrants | Cambodia | 5.8 /100 | #215 | Tragic 5.7% |
| Immigrants | Syria | 5.5 /100 | #216 | Tragic 5.7% |
| Immigrants | Fiji | 5.1 /100 | #217 | Tragic 5.7% |
| Panamanians | 4.5 /100 | #218 | Tragic 5.8% |
| French Canadians | 4.4 /100 | #219 | Tragic 5.8% |
| Sierra Leoneans | 3.9 /100 | #220 | Tragic 5.8% |
| Guamanians/Chamorros | 3.9 /100 | #221 | Tragic 5.8% |
| Spaniards | 3.2 /100 | #222 | Tragic 5.8% |
Demographics Similar to Osage by Unemployment Among Ages 30 to 34 years
In terms of unemployment among ages 30 to 34 years, the demographic groups most similar to Osage are Immigrants from Ecuador (6.3%, a difference of 0.080%), Cree (6.4%, a difference of 0.48%), Cherokee (6.4%, a difference of 0.52%), Pennsylvania German (6.3%, a difference of 0.82%), and Immigrants from Caribbean (6.4%, a difference of 0.84%).
| Demographics | Rating | Rank | Unemployment Among Ages 30 to 34 years |
| Comanche | 0.0 /100 | #271 | Tragic 6.3% |
| Blackfeet | 0.0 /100 | #272 | Tragic 6.3% |
| Ottawa | 0.0 /100 | #273 | Tragic 6.3% |
| U.S. Virgin Islanders | 0.0 /100 | #274 | Tragic 6.3% |
| Ecuadorians | 0.0 /100 | #275 | Tragic 6.3% |
| Pennsylvania Germans | 0.0 /100 | #276 | Tragic 6.3% |
| Immigrants | Ecuador | 0.0 /100 | #277 | Tragic 6.3% |
| Osage | 0.0 /100 | #278 | Tragic 6.3% |
| Cree | 0.0 /100 | #279 | Tragic 6.4% |
| Cherokee | 0.0 /100 | #280 | Tragic 6.4% |
| Immigrants | Caribbean | 0.0 /100 | #281 | Tragic 6.4% |
| Africans | 0.0 /100 | #282 | Tragic 6.4% |
| Hispanics or Latinos | 0.0 /100 | #283 | Tragic 6.4% |
| Immigrants | Bangladesh | 0.0 /100 | #284 | Tragic 6.4% |
| Choctaw | 0.0 /100 | #285 | Tragic 6.4% |