Immigrants from Cambodia vs Immigrants from Zimbabwe Unemployment Among Seniors over 65 years
COMPARE
Immigrants from Cambodia
Immigrants from Zimbabwe
Unemployment Among Seniors over 65 years
Unemployment Among Seniors over 65 years Comparison
Immigrants from Cambodia
Immigrants from Zimbabwe
4.9%
UNEMPLOYMENT AMONG SENIORS OVER 65 YEARS
99.6/ 100
METRIC RATING
64th/ 347
METRIC RANK
5.0%
UNEMPLOYMENT AMONG SENIORS OVER 65 YEARS
98.3/ 100
METRIC RATING
83rd/ 347
METRIC RANK
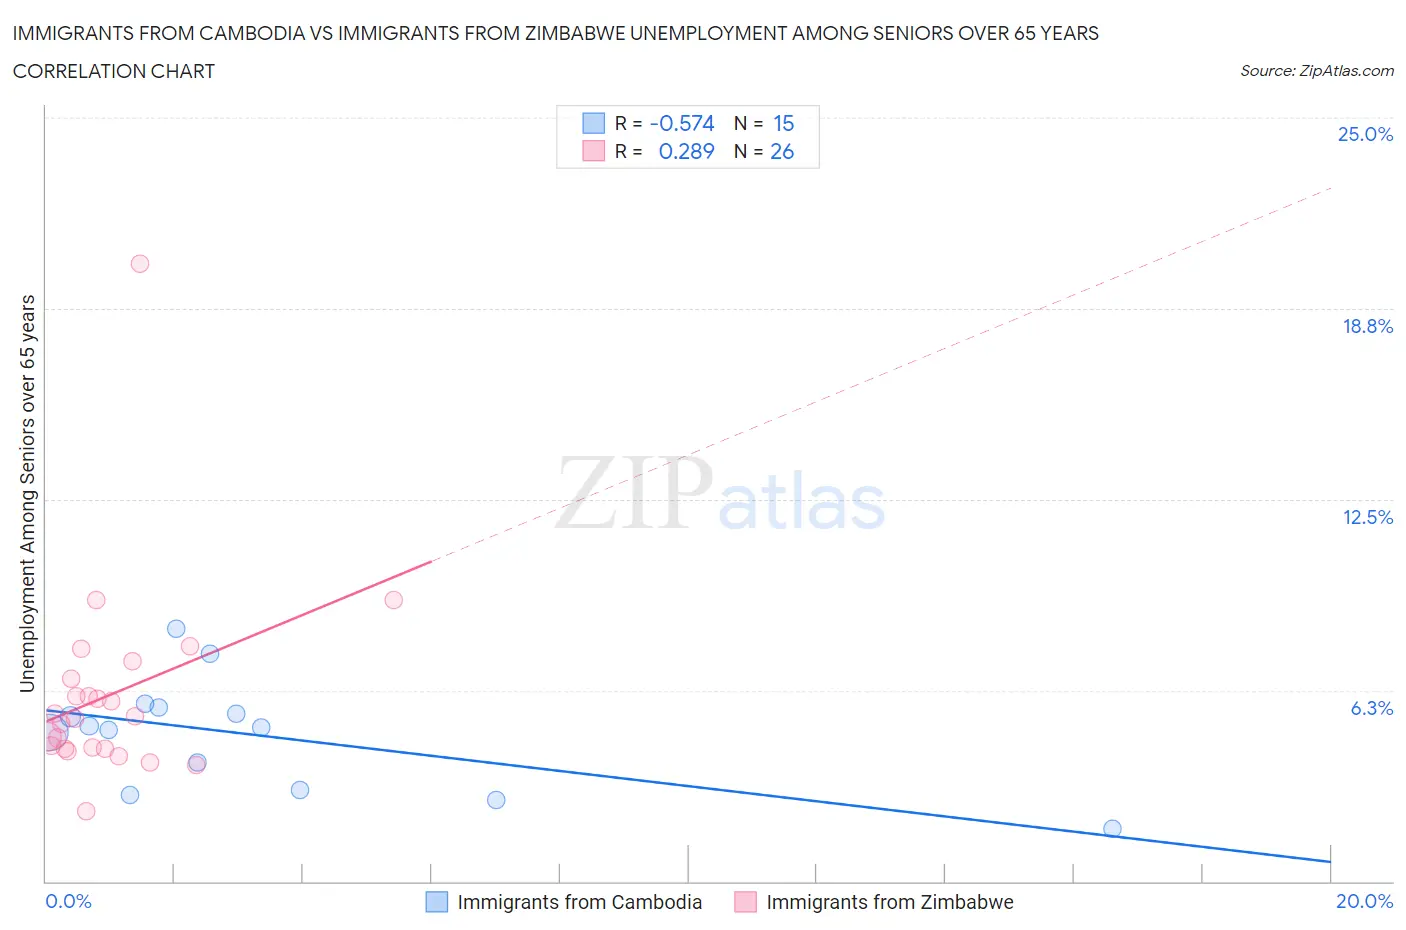
Immigrants from Cambodia vs Immigrants from Zimbabwe Unemployment Among Seniors over 65 years Correlation Chart
The statistical analysis conducted on geographies consisting of 194,845,295 people shows a substantial negative correlation between the proportion of Immigrants from Cambodia and unemployment rate amomg seniors over the age of 65 in the United States with a correlation coefficient (R) of -0.574 and weighted average of 4.9%. Similarly, the statistical analysis conducted on geographies consisting of 114,327,408 people shows a weak positive correlation between the proportion of Immigrants from Zimbabwe and unemployment rate amomg seniors over the age of 65 in the United States with a correlation coefficient (R) of 0.289 and weighted average of 5.0%, a difference of 1.2%.
Unemployment Among Seniors over 65 years Correlation Summary
| Measurement | Immigrants from Cambodia | Immigrants from Zimbabwe |
| Minimum | 1.7% | 2.3% |
| Maximum | 8.3% | 20.2% |
| Range | 6.6% | 17.9% |
| Mean | 4.8% | 6.1% |
| Median | 5.0% | 5.4% |
| Interquartile 25% (IQ1) | 3.0% | 4.4% |
| Interquartile 75% (IQ3) | 5.7% | 6.6% |
| Interquartile Range (IQR) | 2.7% | 2.3% |
| Standard Deviation (Sample) | 1.8% | 3.3% |
| Standard Deviation (Population) | 1.7% | 3.3% |
Demographics Similar to Immigrants from Cambodia and Immigrants from Zimbabwe by Unemployment Among Seniors over 65 years
In terms of unemployment among seniors over 65 years, the demographic groups most similar to Immigrants from Cambodia are Croatian (4.9%, a difference of 0.0%), Immigrants from Nicaragua (4.9%, a difference of 0.080%), English (4.9%, a difference of 0.13%), Iroquois (4.9%, a difference of 0.15%), and Bolivian (4.9%, a difference of 0.19%). Similarly, the demographic groups most similar to Immigrants from Zimbabwe are Serbian (5.0%, a difference of 0.030%), Estonian (5.0%, a difference of 0.060%), Immigrants from Ethiopia (5.0%, a difference of 0.16%), Immigrants from Netherlands (5.0%, a difference of 0.26%), and Slavic (5.0%, a difference of 0.31%).
| Demographics | Rating | Rank | Unemployment Among Seniors over 65 years |
| Croatians | 99.6 /100 | #63 | Exceptional 4.9% |
| Immigrants | Cambodia | 99.6 /100 | #64 | Exceptional 4.9% |
| Immigrants | Nicaragua | 99.6 /100 | #65 | Exceptional 4.9% |
| English | 99.5 /100 | #66 | Exceptional 4.9% |
| Iroquois | 99.5 /100 | #67 | Exceptional 4.9% |
| Bolivians | 99.5 /100 | #68 | Exceptional 4.9% |
| Scottish | 99.5 /100 | #69 | Exceptional 4.9% |
| Immigrants | Kazakhstan | 99.4 /100 | #70 | Exceptional 4.9% |
| Immigrants | Moldova | 99.4 /100 | #71 | Exceptional 4.9% |
| Nicaraguans | 99.3 /100 | #72 | Exceptional 4.9% |
| Immigrants | Japan | 99.2 /100 | #73 | Exceptional 4.9% |
| Japanese | 99.2 /100 | #74 | Exceptional 4.9% |
| British | 99.1 /100 | #75 | Exceptional 4.9% |
| Welsh | 99.1 /100 | #76 | Exceptional 5.0% |
| Thais | 99.1 /100 | #77 | Exceptional 5.0% |
| Slavs | 98.9 /100 | #78 | Exceptional 5.0% |
| Immigrants | Netherlands | 98.8 /100 | #79 | Exceptional 5.0% |
| Immigrants | Ethiopia | 98.6 /100 | #80 | Exceptional 5.0% |
| Estonians | 98.5 /100 | #81 | Exceptional 5.0% |
| Serbians | 98.4 /100 | #82 | Exceptional 5.0% |
| Immigrants | Zimbabwe | 98.3 /100 | #83 | Exceptional 5.0% |