Immigrants from Cambodia vs Immigrants from Spain Unemployment Among Ages 65 to 74 years
COMPARE
Immigrants from Cambodia
Immigrants from Spain
Unemployment Among Ages 65 to 74 years
Unemployment Among Ages 65 to 74 years Comparison
Immigrants from Cambodia
Immigrants from Spain
5.2%
UNEMPLOYMENT AMONG AGES 65 TO 74 YEARS
96.3/ 100
METRIC RATING
101st/ 347
METRIC RANK
5.4%
UNEMPLOYMENT AMONG AGES 65 TO 74 YEARS
37.3/ 100
METRIC RATING
183rd/ 347
METRIC RANK
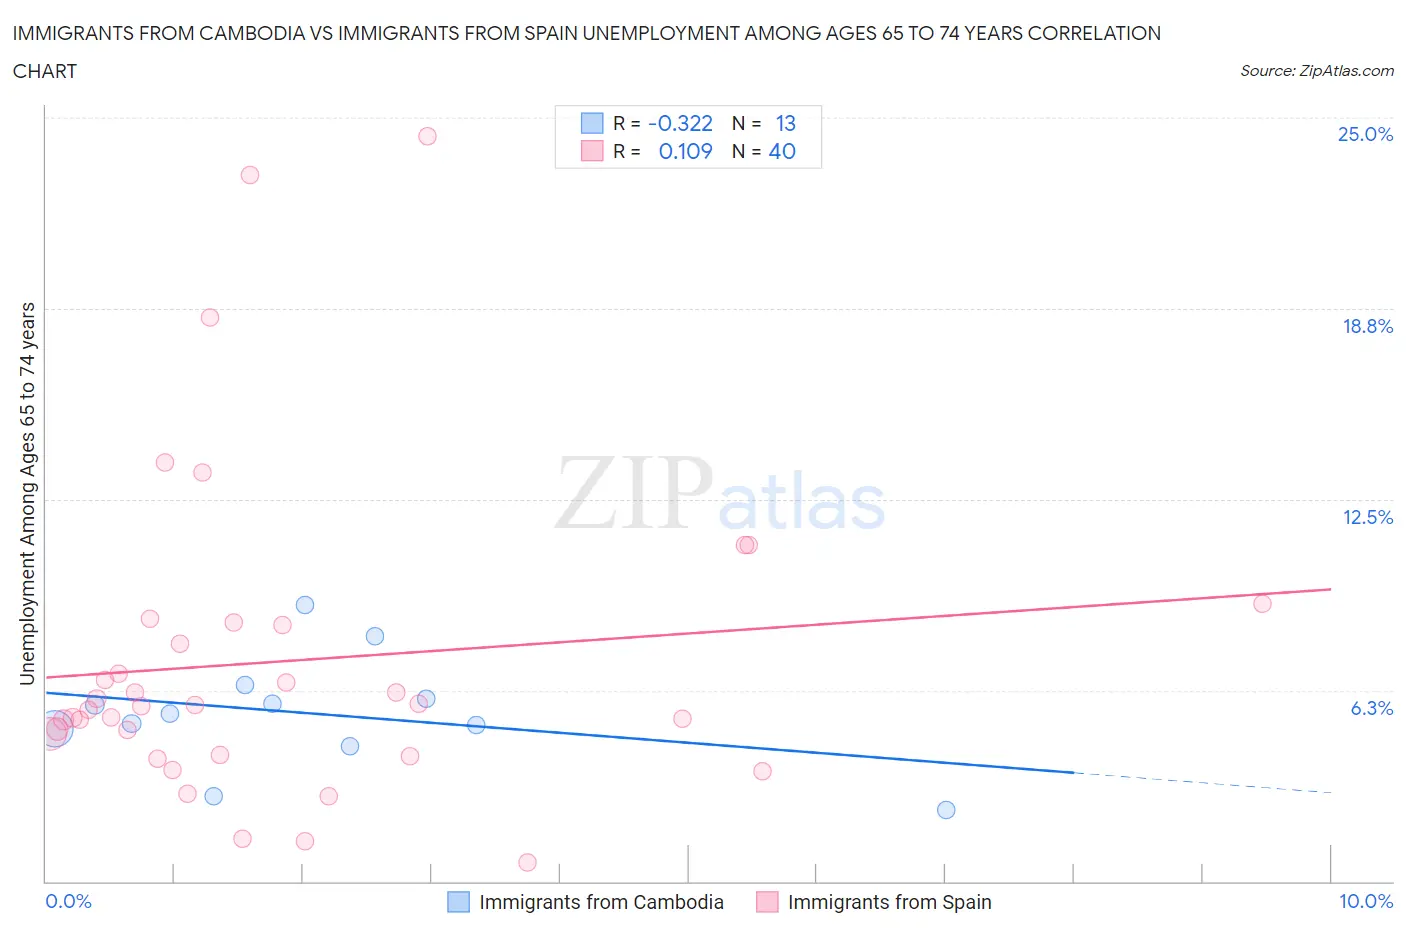
Immigrants from Cambodia vs Immigrants from Spain Unemployment Among Ages 65 to 74 years Correlation Chart
The statistical analysis conducted on geographies consisting of 192,440,418 people shows a mild negative correlation between the proportion of Immigrants from Cambodia and unemployment rate among population between the ages 65 and 74 in the United States with a correlation coefficient (R) of -0.322 and weighted average of 5.2%. Similarly, the statistical analysis conducted on geographies consisting of 223,058,481 people shows a poor positive correlation between the proportion of Immigrants from Spain and unemployment rate among population between the ages 65 and 74 in the United States with a correlation coefficient (R) of 0.109 and weighted average of 5.4%, a difference of 3.2%.
Unemployment Among Ages 65 to 74 years Correlation Summary
| Measurement | Immigrants from Cambodia | Immigrants from Spain |
| Minimum | 2.3% | 0.60% |
| Maximum | 9.1% | 24.4% |
| Range | 6.7% | 23.8% |
| Mean | 5.5% | 7.2% |
| Median | 5.5% | 5.8% |
| Interquartile 25% (IQ1) | 4.7% | 4.5% |
| Interquartile 75% (IQ3) | 6.2% | 8.4% |
| Interquartile Range (IQR) | 1.5% | 4.0% |
| Standard Deviation (Sample) | 1.8% | 5.2% |
| Standard Deviation (Population) | 1.7% | 5.1% |
Similar Demographics by Unemployment Among Ages 65 to 74 years
Demographics Similar to Immigrants from Cambodia by Unemployment Among Ages 65 to 74 years
In terms of unemployment among ages 65 to 74 years, the demographic groups most similar to Immigrants from Cambodia are Japanese (5.2%, a difference of 0.0%), Burmese (5.2%, a difference of 0.020%), Welsh (5.2%, a difference of 0.040%), Senegalese (5.2%, a difference of 0.050%), and Immigrants from Lithuania (5.2%, a difference of 0.10%).
| Demographics | Rating | Rank | Unemployment Among Ages 65 to 74 years |
| South Africans | 97.1 /100 | #94 | Exceptional 5.2% |
| Serbians | 97.0 /100 | #95 | Exceptional 5.2% |
| Immigrants | Thailand | 97.0 /100 | #96 | Exceptional 5.2% |
| Senegalese | 96.5 /100 | #97 | Exceptional 5.2% |
| Welsh | 96.5 /100 | #98 | Exceptional 5.2% |
| Burmese | 96.4 /100 | #99 | Exceptional 5.2% |
| Japanese | 96.4 /100 | #100 | Exceptional 5.2% |
| Immigrants | Cambodia | 96.3 /100 | #101 | Exceptional 5.2% |
| Immigrants | Lithuania | 95.9 /100 | #102 | Exceptional 5.2% |
| Immigrants | Vietnam | 95.6 /100 | #103 | Exceptional 5.2% |
| Yugoslavians | 95.5 /100 | #104 | Exceptional 5.2% |
| Iranians | 95.2 /100 | #105 | Exceptional 5.2% |
| Malaysians | 95.1 /100 | #106 | Exceptional 5.2% |
| Austrians | 94.5 /100 | #107 | Exceptional 5.2% |
| Immigrants | Malaysia | 94.1 /100 | #108 | Exceptional 5.2% |
Demographics Similar to Immigrants from Spain by Unemployment Among Ages 65 to 74 years
In terms of unemployment among ages 65 to 74 years, the demographic groups most similar to Immigrants from Spain are Spanish American (5.4%, a difference of 0.030%), Immigrants from Senegal (5.4%, a difference of 0.080%), Soviet Union (5.4%, a difference of 0.090%), Russian (5.4%, a difference of 0.11%), and Immigrants from Ireland (5.4%, a difference of 0.16%).
| Demographics | Rating | Rank | Unemployment Among Ages 65 to 74 years |
| Immigrants | Western Europe | 47.3 /100 | #176 | Average 5.4% |
| Arabs | 46.8 /100 | #177 | Average 5.4% |
| French | 43.1 /100 | #178 | Average 5.4% |
| Guamanians/Chamorros | 42.1 /100 | #179 | Average 5.4% |
| Immigrants | Ireland | 42.0 /100 | #180 | Average 5.4% |
| Soviet Union | 40.0 /100 | #181 | Fair 5.4% |
| Spanish Americans | 38.2 /100 | #182 | Fair 5.4% |
| Immigrants | Spain | 37.3 /100 | #183 | Fair 5.4% |
| Immigrants | Senegal | 35.2 /100 | #184 | Fair 5.4% |
| Russians | 34.4 /100 | #185 | Fair 5.4% |
| Lithuanians | 32.4 /100 | #186 | Fair 5.4% |
| Immigrants | Nonimmigrants | 30.6 /100 | #187 | Fair 5.4% |
| Immigrants | Europe | 28.8 /100 | #188 | Fair 5.4% |
| Immigrants | Africa | 28.3 /100 | #189 | Fair 5.4% |
| Basques | 26.6 /100 | #190 | Fair 5.4% |