Immigrants from Cambodia vs French American Indian Unemployment Among Youth under 25 years
COMPARE
Immigrants from Cambodia
French American Indian
Unemployment Among Youth under 25 years
Unemployment Among Youth under 25 years Comparison
Immigrants from Cambodia
French American Indians
11.5%
UNEMPLOYMENT AMONG YOUTH UNDER 25 YEARS
71.8/ 100
METRIC RATING
149th/ 347
METRIC RANK
11.7%
UNEMPLOYMENT AMONG YOUTH UNDER 25 YEARS
34.0/ 100
METRIC RATING
185th/ 347
METRIC RANK
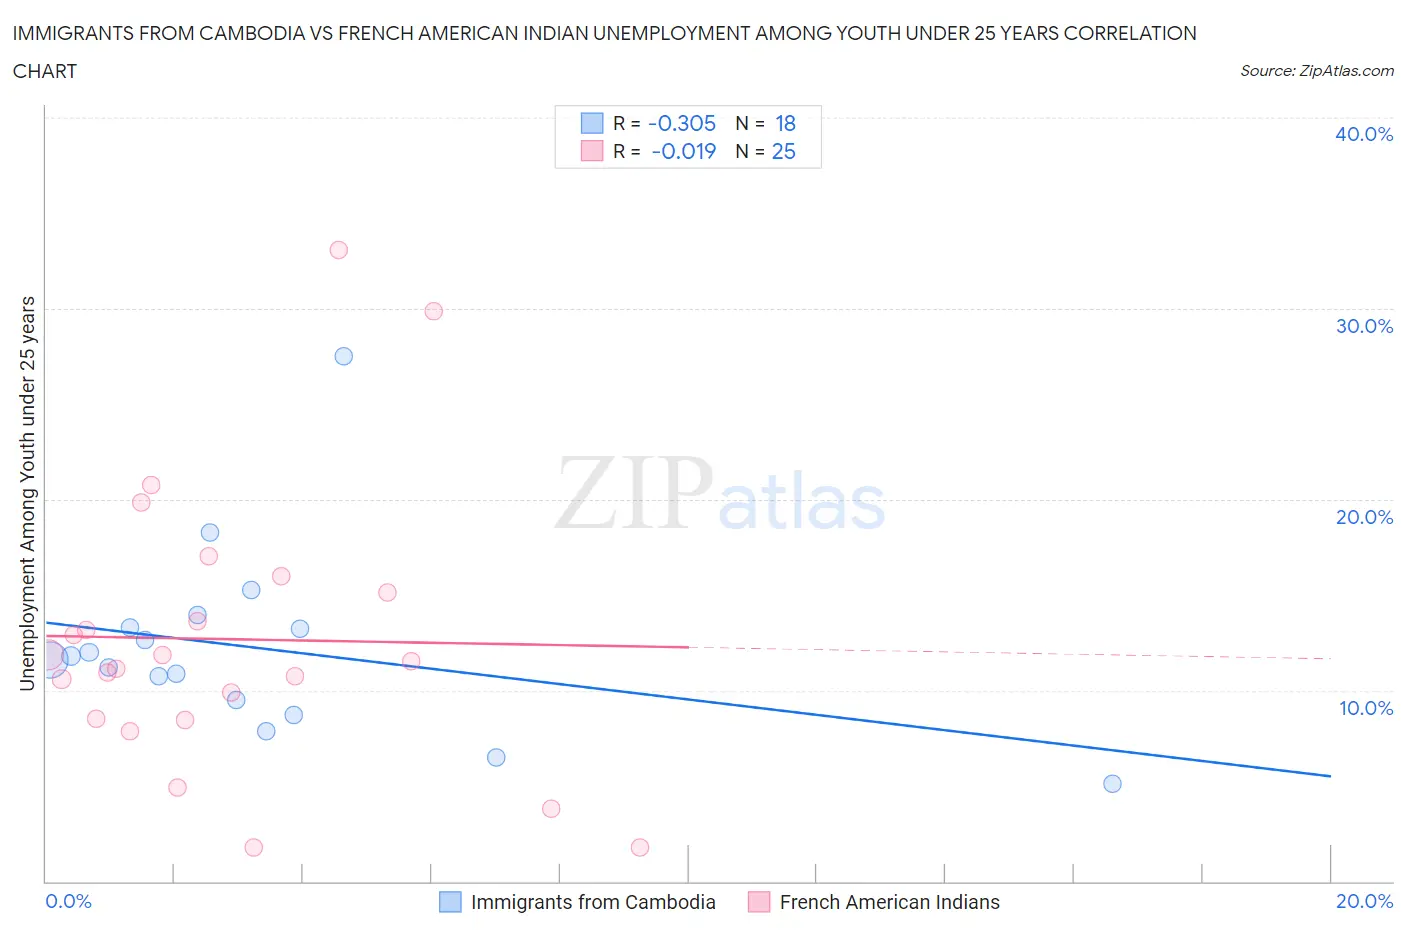
Immigrants from Cambodia vs French American Indian Unemployment Among Youth under 25 years Correlation Chart
The statistical analysis conducted on geographies consisting of 204,519,643 people shows a mild negative correlation between the proportion of Immigrants from Cambodia and unemployment rate among youth under the age of 25 in the United States with a correlation coefficient (R) of -0.305 and weighted average of 11.5%. Similarly, the statistical analysis conducted on geographies consisting of 130,975,781 people shows no correlation between the proportion of French American Indians and unemployment rate among youth under the age of 25 in the United States with a correlation coefficient (R) of -0.019 and weighted average of 11.7%, a difference of 1.7%.
Unemployment Among Youth under 25 years Correlation Summary
| Measurement | Immigrants from Cambodia | French American Indian |
| Minimum | 5.1% | 1.8% |
| Maximum | 27.5% | 33.1% |
| Range | 22.4% | 31.3% |
| Mean | 12.2% | 12.7% |
| Median | 11.7% | 11.5% |
| Interquartile 25% (IQ1) | 9.5% | 8.5% |
| Interquartile 75% (IQ3) | 13.3% | 15.5% |
| Interquartile Range (IQR) | 3.8% | 7.1% |
| Standard Deviation (Sample) | 4.9% | 7.4% |
| Standard Deviation (Population) | 4.8% | 7.3% |
Similar Demographics by Unemployment Among Youth under 25 years
Demographics Similar to Immigrants from Cambodia by Unemployment Among Youth under 25 years
In terms of unemployment among youth under 25 years, the demographic groups most similar to Immigrants from Cambodia are Immigrants from Northern Europe (11.5%, a difference of 0.010%), Immigrants from Switzerland (11.5%, a difference of 0.010%), Laotian (11.5%, a difference of 0.030%), Brazilian (11.5%, a difference of 0.040%), and Argentinean (11.5%, a difference of 0.060%).
| Demographics | Rating | Rank | Unemployment Among Youth under 25 years |
| Immigrants | Korea | 75.1 /100 | #142 | Good 11.5% |
| Immigrants | Uganda | 74.5 /100 | #143 | Good 11.5% |
| Immigrants | Brazil | 74.3 /100 | #144 | Good 11.5% |
| Argentineans | 73.0 /100 | #145 | Good 11.5% |
| Brazilians | 72.5 /100 | #146 | Good 11.5% |
| Laotians | 72.4 /100 | #147 | Good 11.5% |
| Immigrants | Northern Europe | 72.1 /100 | #148 | Good 11.5% |
| Immigrants | Cambodia | 71.8 /100 | #149 | Good 11.5% |
| Immigrants | Switzerland | 71.6 /100 | #150 | Good 11.5% |
| Uruguayans | 70.4 /100 | #151 | Good 11.5% |
| Iraqis | 68.3 /100 | #152 | Good 11.5% |
| Immigrants | Czechoslovakia | 67.1 /100 | #153 | Good 11.5% |
| Immigrants | Asia | 66.7 /100 | #154 | Good 11.5% |
| Immigrants | Romania | 66.3 /100 | #155 | Good 11.5% |
| Immigrants | Germany | 65.9 /100 | #156 | Good 11.5% |
Demographics Similar to French American Indians by Unemployment Among Youth under 25 years
In terms of unemployment among youth under 25 years, the demographic groups most similar to French American Indians are Maltese (11.7%, a difference of 0.0%), Immigrants from Eastern Europe (11.7%, a difference of 0.010%), American (11.7%, a difference of 0.020%), Immigrants from Egypt (11.7%, a difference of 0.090%), and Immigrants from Italy (11.7%, a difference of 0.10%).
| Demographics | Rating | Rank | Unemployment Among Youth under 25 years |
| Immigrants | Europe | 42.4 /100 | #178 | Average 11.6% |
| Immigrants | Hong Kong | 42.4 /100 | #179 | Average 11.6% |
| Spaniards | 39.8 /100 | #180 | Fair 11.7% |
| Syrians | 38.4 /100 | #181 | Fair 11.7% |
| Immigrants | Italy | 36.2 /100 | #182 | Fair 11.7% |
| Americans | 34.5 /100 | #183 | Fair 11.7% |
| Immigrants | Eastern Europe | 34.1 /100 | #184 | Fair 11.7% |
| French American Indians | 34.0 /100 | #185 | Fair 11.7% |
| Maltese | 33.9 /100 | #186 | Fair 11.7% |
| Immigrants | Egypt | 31.9 /100 | #187 | Fair 11.7% |
| Immigrants | Poland | 31.4 /100 | #188 | Fair 11.7% |
| Japanese | 30.8 /100 | #189 | Fair 11.7% |
| Portuguese | 30.3 /100 | #190 | Fair 11.7% |
| Cypriots | 28.5 /100 | #191 | Fair 11.7% |
| Immigrants | Russia | 28.5 /100 | #192 | Fair 11.7% |