Immigrants from Cabo Verde vs French Unemployment Among Ages 45 to 54 years
COMPARE
Immigrants from Cabo Verde
French
Unemployment Among Ages 45 to 54 years
Unemployment Among Ages 45 to 54 years Comparison
Immigrants from Cabo Verde
French
5.9%
UNEMPLOYMENT AMONG AGES 45 TO 54 YEARS
0.0/ 100
METRIC RATING
323rd/ 347
METRIC RANK
4.3%
UNEMPLOYMENT AMONG AGES 45 TO 54 YEARS
97.3/ 100
METRIC RATING
85th/ 347
METRIC RANK
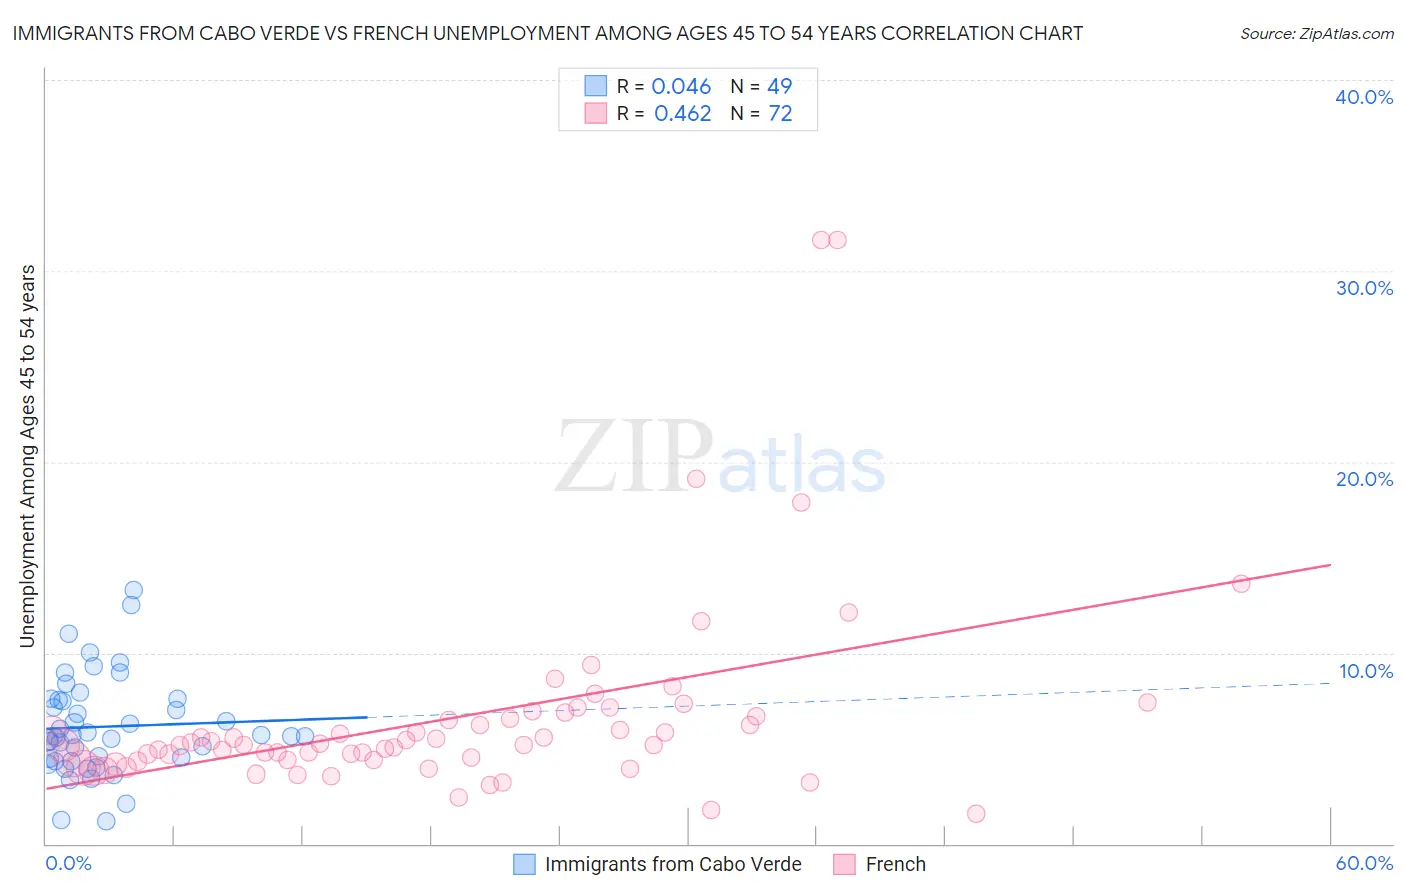
Immigrants from Cabo Verde vs French Unemployment Among Ages 45 to 54 years Correlation Chart
The statistical analysis conducted on geographies consisting of 37,908,460 people shows no correlation between the proportion of Immigrants from Cabo Verde and unemployment rate among population between the ages 45 and 54 in the United States with a correlation coefficient (R) of 0.046 and weighted average of 5.9%. Similarly, the statistical analysis conducted on geographies consisting of 529,343,979 people shows a moderate positive correlation between the proportion of French and unemployment rate among population between the ages 45 and 54 in the United States with a correlation coefficient (R) of 0.462 and weighted average of 4.3%, a difference of 36.6%.
Unemployment Among Ages 45 to 54 years Correlation Summary
| Measurement | Immigrants from Cabo Verde | French |
| Minimum | 1.2% | 1.6% |
| Maximum | 13.3% | 31.6% |
| Range | 12.1% | 30.0% |
| Mean | 6.1% | 6.6% |
| Median | 5.7% | 5.2% |
| Interquartile 25% (IQ1) | 4.4% | 4.4% |
| Interquartile 75% (IQ3) | 7.6% | 6.6% |
| Interquartile Range (IQR) | 3.2% | 2.2% |
| Standard Deviation (Sample) | 2.6% | 5.2% |
| Standard Deviation (Population) | 2.5% | 5.2% |
Similar Demographics by Unemployment Among Ages 45 to 54 years
Demographics Similar to Immigrants from Cabo Verde by Unemployment Among Ages 45 to 54 years
In terms of unemployment among ages 45 to 54 years, the demographic groups most similar to Immigrants from Cabo Verde are Native/Alaskan (6.1%, a difference of 2.3%), Immigrants from the Azores (5.7%, a difference of 3.0%), Yakama (5.7%, a difference of 3.5%), Immigrants from Armenia (6.1%, a difference of 3.7%), and Immigrants from St. Vincent and the Grenadines (5.7%, a difference of 3.8%).
| Demographics | Rating | Rank | Unemployment Among Ages 45 to 54 years |
| Immigrants | Guyana | 0.0 /100 | #316 | Tragic 5.6% |
| Houma | 0.0 /100 | #317 | Tragic 5.6% |
| British West Indians | 0.0 /100 | #318 | Tragic 5.7% |
| Cape Verdeans | 0.0 /100 | #319 | Tragic 5.7% |
| Immigrants | St. Vincent and the Grenadines | 0.0 /100 | #320 | Tragic 5.7% |
| Yakama | 0.0 /100 | #321 | Tragic 5.7% |
| Immigrants | Azores | 0.0 /100 | #322 | Tragic 5.7% |
| Immigrants | Cabo Verde | 0.0 /100 | #323 | Tragic 5.9% |
| Natives/Alaskans | 0.0 /100 | #324 | Tragic 6.1% |
| Immigrants | Armenia | 0.0 /100 | #325 | Tragic 6.1% |
| Ute | 0.0 /100 | #326 | Tragic 6.2% |
| Dominicans | 0.0 /100 | #327 | Tragic 6.2% |
| Pueblo | 0.0 /100 | #328 | Tragic 6.2% |
| Alaska Natives | 0.0 /100 | #329 | Tragic 6.3% |
| Immigrants | Dominican Republic | 0.0 /100 | #330 | Tragic 6.3% |
Demographics Similar to French by Unemployment Among Ages 45 to 54 years
In terms of unemployment among ages 45 to 54 years, the demographic groups most similar to French are Italian (4.3%, a difference of 0.0%), Australian (4.3%, a difference of 0.040%), Ethiopian (4.3%, a difference of 0.040%), Eastern European (4.3%, a difference of 0.12%), and Sudanese (4.3%, a difference of 0.14%).
| Demographics | Rating | Rank | Unemployment Among Ages 45 to 54 years |
| German Russians | 97.9 /100 | #78 | Exceptional 4.3% |
| Serbians | 97.9 /100 | #79 | Exceptional 4.3% |
| Cambodians | 97.8 /100 | #80 | Exceptional 4.3% |
| Immigrants | Micronesia | 97.6 /100 | #81 | Exceptional 4.3% |
| Eastern Europeans | 97.6 /100 | #82 | Exceptional 4.3% |
| Australians | 97.4 /100 | #83 | Exceptional 4.3% |
| Italians | 97.3 /100 | #84 | Exceptional 4.3% |
| French | 97.3 /100 | #85 | Exceptional 4.3% |
| Ethiopians | 97.2 /100 | #86 | Exceptional 4.3% |
| Sudanese | 97.0 /100 | #87 | Exceptional 4.3% |
| Immigrants | Turkey | 96.9 /100 | #88 | Exceptional 4.3% |
| Immigrants | Argentina | 96.9 /100 | #89 | Exceptional 4.3% |
| Asians | 96.8 /100 | #90 | Exceptional 4.3% |
| Ukrainians | 96.6 /100 | #91 | Exceptional 4.3% |
| Mongolians | 96.6 /100 | #92 | Exceptional 4.3% |