Immigrants from Bulgaria vs Immigrants from Burma/Myanmar Unemployment Among Seniors over 65 years
COMPARE
Immigrants from Bulgaria
Immigrants from Burma/Myanmar
Unemployment Among Seniors over 65 years
Unemployment Among Seniors over 65 years Comparison
Immigrants from Bulgaria
Immigrants from Burma/Myanmar
5.0%
UNEMPLOYMENT AMONG SENIORS OVER 65 YEARS
97.3/ 100
METRIC RATING
92nd/ 347
METRIC RANK
4.6%
UNEMPLOYMENT AMONG SENIORS OVER 65 YEARS
100.0/ 100
METRIC RATING
16th/ 347
METRIC RANK
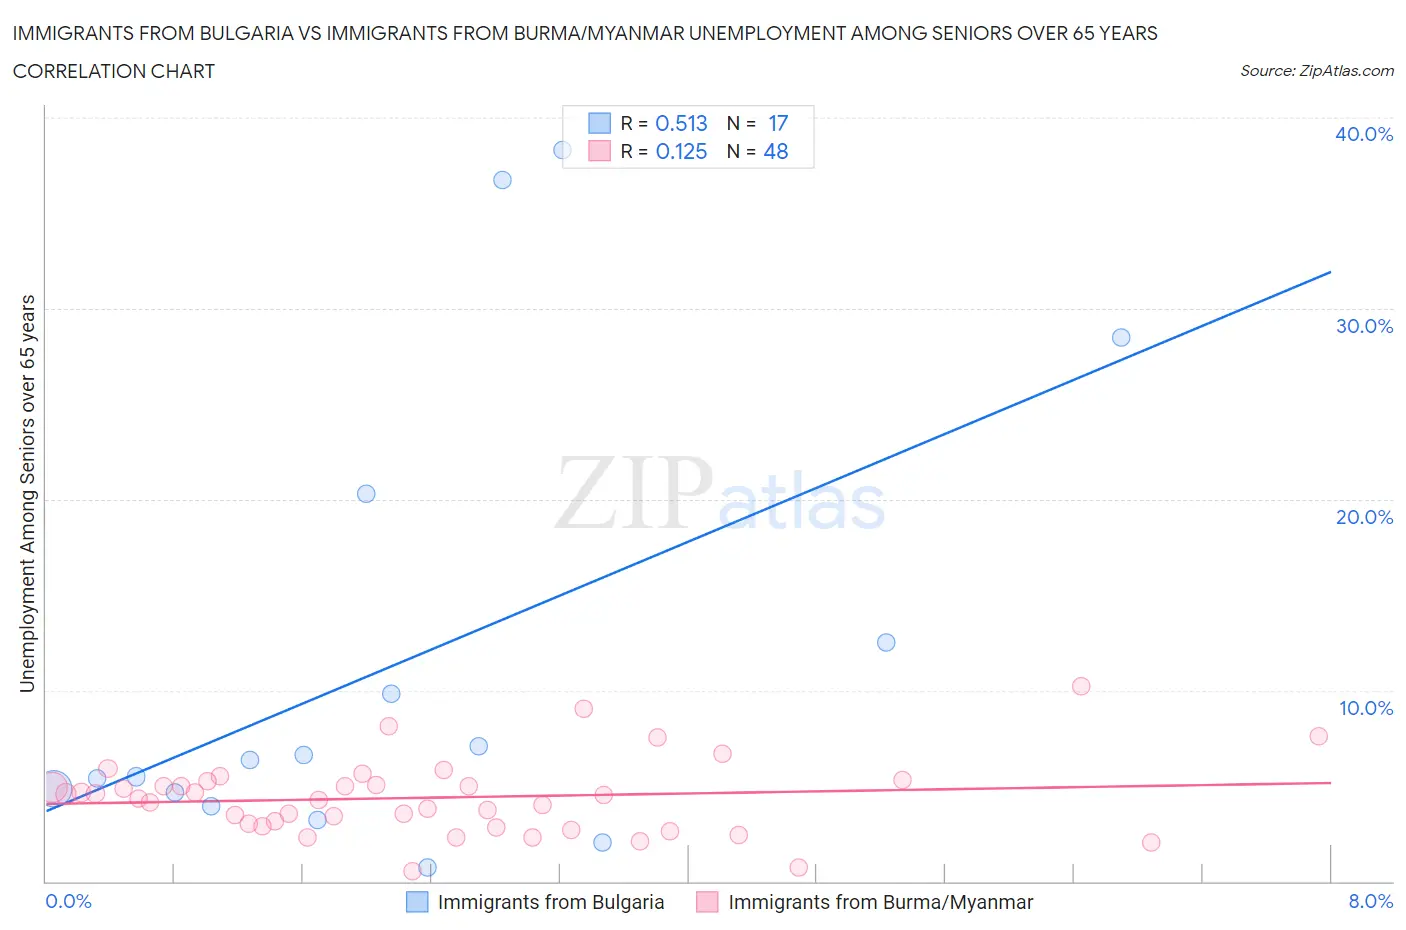
Immigrants from Bulgaria vs Immigrants from Burma/Myanmar Unemployment Among Seniors over 65 years Correlation Chart
The statistical analysis conducted on geographies consisting of 165,167,478 people shows a substantial positive correlation between the proportion of Immigrants from Bulgaria and unemployment rate amomg seniors over the age of 65 in the United States with a correlation coefficient (R) of 0.513 and weighted average of 5.0%. Similarly, the statistical analysis conducted on geographies consisting of 164,420,398 people shows a poor positive correlation between the proportion of Immigrants from Burma/Myanmar and unemployment rate amomg seniors over the age of 65 in the United States with a correlation coefficient (R) of 0.125 and weighted average of 4.6%, a difference of 7.9%.
Unemployment Among Seniors over 65 years Correlation Summary
| Measurement | Immigrants from Bulgaria | Immigrants from Burma/Myanmar |
| Minimum | 0.70% | 0.53% |
| Maximum | 38.3% | 10.2% |
| Range | 37.6% | 9.7% |
| Mean | 11.6% | 4.4% |
| Median | 6.4% | 4.4% |
| Interquartile 25% (IQ1) | 4.3% | 3.0% |
| Interquartile 75% (IQ3) | 16.4% | 5.1% |
| Interquartile Range (IQR) | 12.1% | 2.2% |
| Standard Deviation (Sample) | 12.0% | 2.0% |
| Standard Deviation (Population) | 11.6% | 1.9% |
Similar Demographics by Unemployment Among Seniors over 65 years
Demographics Similar to Immigrants from Bulgaria by Unemployment Among Seniors over 65 years
In terms of unemployment among seniors over 65 years, the demographic groups most similar to Immigrants from Bulgaria are Austrian (5.0%, a difference of 0.0%), Immigrants from Bolivia (5.0%, a difference of 0.020%), Immigrants from South Africa (5.0%, a difference of 0.10%), Immigrants from South Central Asia (5.0%, a difference of 0.11%), and Afghan (5.0%, a difference of 0.12%).
| Demographics | Rating | Rank | Unemployment Among Seniors over 65 years |
| Immigrants | Hungary | 98.2 /100 | #85 | Exceptional 5.0% |
| Immigrants | Taiwan | 98.2 /100 | #86 | Exceptional 5.0% |
| Immigrants | Switzerland | 98.2 /100 | #87 | Exceptional 5.0% |
| Afghans | 97.6 /100 | #88 | Exceptional 5.0% |
| Immigrants | South Central Asia | 97.6 /100 | #89 | Exceptional 5.0% |
| Immigrants | South Africa | 97.6 /100 | #90 | Exceptional 5.0% |
| Immigrants | Bolivia | 97.3 /100 | #91 | Exceptional 5.0% |
| Immigrants | Bulgaria | 97.3 /100 | #92 | Exceptional 5.0% |
| Austrians | 97.3 /100 | #93 | Exceptional 5.0% |
| Burmese | 96.8 /100 | #94 | Exceptional 5.0% |
| Assyrians/Chaldeans/Syriacs | 96.8 /100 | #95 | Exceptional 5.0% |
| Immigrants | Singapore | 96.8 /100 | #96 | Exceptional 5.0% |
| Immigrants | Oceania | 96.8 /100 | #97 | Exceptional 5.0% |
| Czechoslovakians | 96.7 /100 | #98 | Exceptional 5.0% |
| South Africans | 96.5 /100 | #99 | Exceptional 5.0% |
Demographics Similar to Immigrants from Burma/Myanmar by Unemployment Among Seniors over 65 years
In terms of unemployment among seniors over 65 years, the demographic groups most similar to Immigrants from Burma/Myanmar are Lumbee (4.6%, a difference of 0.010%), Menominee (4.6%, a difference of 0.080%), Creek (4.6%, a difference of 0.11%), Immigrants from Eritrea (4.7%, a difference of 0.40%), and Cuban (4.6%, a difference of 0.52%).
| Demographics | Rating | Rank | Unemployment Among Seniors over 65 years |
| Indonesians | 100.0 /100 | #9 | Exceptional 4.5% |
| Immigrants | Zaire | 100.0 /100 | #10 | Exceptional 4.5% |
| Comanche | 100.0 /100 | #11 | Exceptional 4.6% |
| Osage | 100.0 /100 | #12 | Exceptional 4.6% |
| Cubans | 100.0 /100 | #13 | Exceptional 4.6% |
| Menominee | 100.0 /100 | #14 | Exceptional 4.6% |
| Lumbee | 100.0 /100 | #15 | Exceptional 4.6% |
| Immigrants | Burma/Myanmar | 100.0 /100 | #16 | Exceptional 4.6% |
| Creek | 100.0 /100 | #17 | Exceptional 4.6% |
| Immigrants | Eritrea | 100.0 /100 | #18 | Exceptional 4.7% |
| Lebanese | 100.0 /100 | #19 | Exceptional 4.7% |
| Immigrants | Nepal | 100.0 /100 | #20 | Exceptional 4.7% |
| Norwegians | 100.0 /100 | #21 | Exceptional 4.7% |
| Czechs | 100.0 /100 | #22 | Exceptional 4.7% |
| Kenyans | 100.0 /100 | #23 | Exceptional 4.7% |