Immigrants from Bulgaria vs Immigrants from Armenia Unemployment Among Ages 55 to 59 years
COMPARE
Immigrants from Bulgaria
Immigrants from Armenia
Unemployment Among Ages 55 to 59 years
Unemployment Among Ages 55 to 59 years Comparison
Immigrants from Bulgaria
Immigrants from Armenia
4.5%
UNEMPLOYMENT AMONG AGES 55 TO 59 YEARS
99.9/ 100
METRIC RATING
37th/ 347
METRIC RANK
6.0%
UNEMPLOYMENT AMONG AGES 55 TO 59 YEARS
0.0/ 100
METRIC RATING
325th/ 347
METRIC RANK
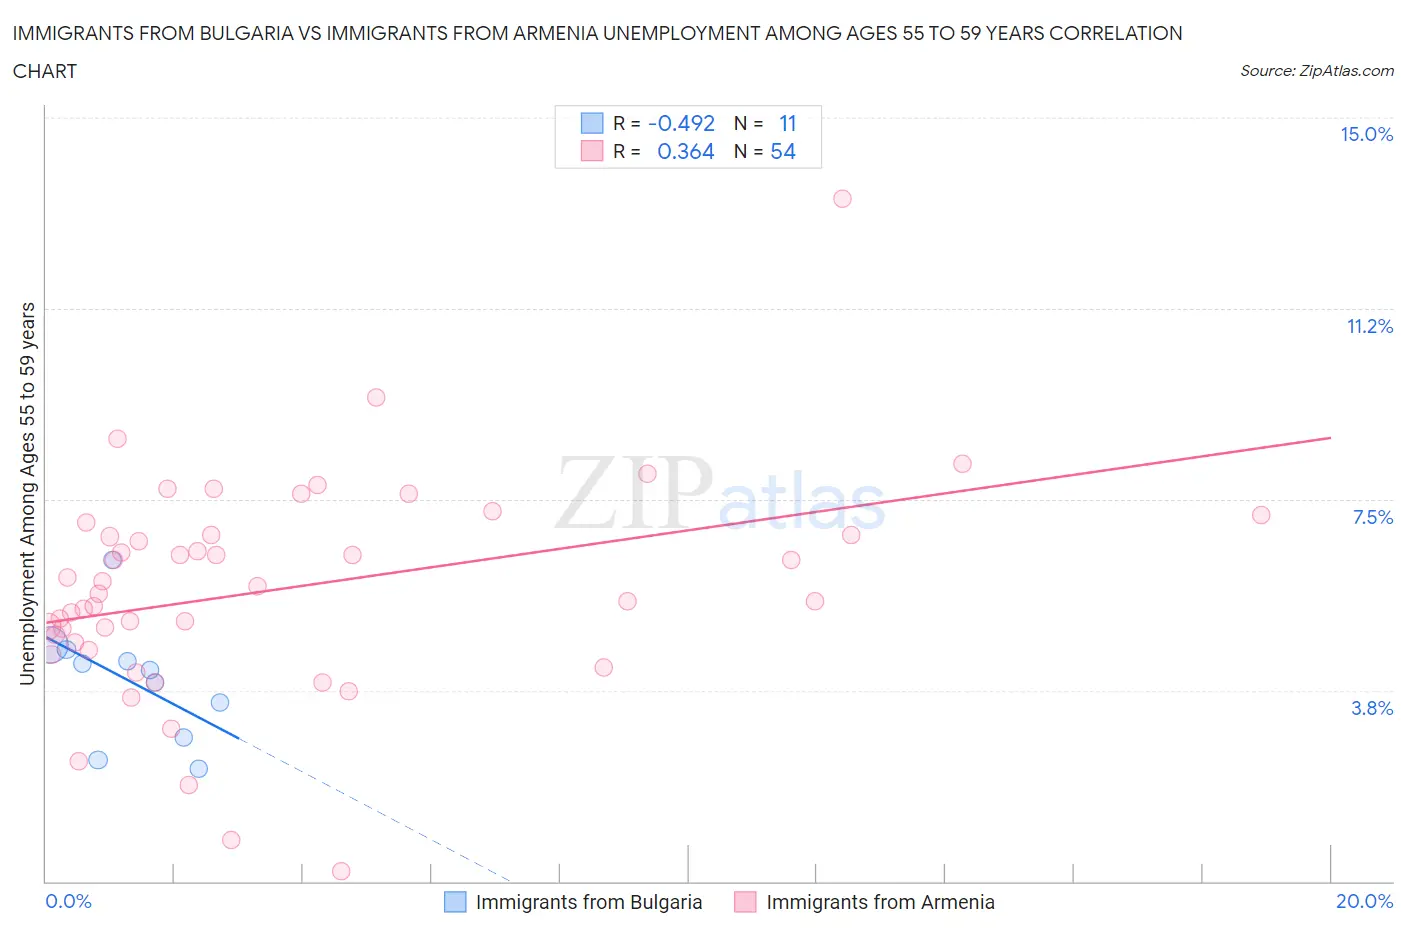
Immigrants from Bulgaria vs Immigrants from Armenia Unemployment Among Ages 55 to 59 years Correlation Chart
The statistical analysis conducted on geographies consisting of 167,622,815 people shows a moderate negative correlation between the proportion of Immigrants from Bulgaria and unemployment rate among population between the ages 55 and 59 in the United States with a correlation coefficient (R) of -0.492 and weighted average of 4.5%. Similarly, the statistical analysis conducted on geographies consisting of 96,295,490 people shows a mild positive correlation between the proportion of Immigrants from Armenia and unemployment rate among population between the ages 55 and 59 in the United States with a correlation coefficient (R) of 0.364 and weighted average of 6.0%, a difference of 33.6%.
Unemployment Among Ages 55 to 59 years Correlation Summary
| Measurement | Immigrants from Bulgaria | Immigrants from Armenia |
| Minimum | 2.2% | 0.20% |
| Maximum | 6.3% | 13.4% |
| Range | 4.1% | 13.2% |
| Mean | 3.9% | 5.7% |
| Median | 4.2% | 5.7% |
| Interquartile 25% (IQ1) | 2.8% | 4.7% |
| Interquartile 75% (IQ3) | 4.5% | 6.8% |
| Interquartile Range (IQR) | 1.7% | 2.1% |
| Standard Deviation (Sample) | 1.2% | 2.1% |
| Standard Deviation (Population) | 1.1% | 2.1% |
Similar Demographics by Unemployment Among Ages 55 to 59 years
Demographics Similar to Immigrants from Bulgaria by Unemployment Among Ages 55 to 59 years
In terms of unemployment among ages 55 to 59 years, the demographic groups most similar to Immigrants from Bulgaria are Ethiopian (4.5%, a difference of 0.0%), Cypriot (4.5%, a difference of 0.090%), Thai (4.5%, a difference of 0.10%), Assyrian/Chaldean/Syriac (4.5%, a difference of 0.18%), and Belgian (4.5%, a difference of 0.19%).
| Demographics | Rating | Rank | Unemployment Among Ages 55 to 59 years |
| Immigrants | Kenya | 99.9 /100 | #30 | Exceptional 4.5% |
| Germans | 99.9 /100 | #31 | Exceptional 4.5% |
| Immigrants | Ethiopia | 99.9 /100 | #32 | Exceptional 4.5% |
| Belgians | 99.9 /100 | #33 | Exceptional 4.5% |
| Thais | 99.9 /100 | #34 | Exceptional 4.5% |
| Cypriots | 99.9 /100 | #35 | Exceptional 4.5% |
| Ethiopians | 99.9 /100 | #36 | Exceptional 4.5% |
| Immigrants | Bulgaria | 99.9 /100 | #37 | Exceptional 4.5% |
| Assyrians/Chaldeans/Syriacs | 99.9 /100 | #38 | Exceptional 4.5% |
| English | 99.9 /100 | #39 | Exceptional 4.5% |
| Swiss | 99.8 /100 | #40 | Exceptional 4.5% |
| Luxembourgers | 99.8 /100 | #41 | Exceptional 4.5% |
| Immigrants | Kuwait | 99.8 /100 | #42 | Exceptional 4.5% |
| Immigrants | Korea | 99.8 /100 | #43 | Exceptional 4.5% |
| Europeans | 99.8 /100 | #44 | Exceptional 4.5% |
Demographics Similar to Immigrants from Armenia by Unemployment Among Ages 55 to 59 years
In terms of unemployment among ages 55 to 59 years, the demographic groups most similar to Immigrants from Armenia are Native/Alaskan (6.0%, a difference of 0.37%), Arapaho (6.1%, a difference of 1.3%), Vietnamese (5.9%, a difference of 1.8%), Immigrants from Bangladesh (5.9%, a difference of 1.8%), and Crow (5.9%, a difference of 1.8%).
| Demographics | Rating | Rank | Unemployment Among Ages 55 to 59 years |
| Immigrants | Guyana | 0.0 /100 | #318 | Tragic 5.8% |
| Kiowa | 0.0 /100 | #319 | Tragic 5.8% |
| Immigrants | Azores | 0.0 /100 | #320 | Tragic 5.8% |
| Chippewa | 0.0 /100 | #321 | Tragic 5.9% |
| Crow | 0.0 /100 | #322 | Tragic 5.9% |
| Immigrants | Bangladesh | 0.0 /100 | #323 | Tragic 5.9% |
| Vietnamese | 0.0 /100 | #324 | Tragic 5.9% |
| Immigrants | Armenia | 0.0 /100 | #325 | Tragic 6.0% |
| Natives/Alaskans | 0.0 /100 | #326 | Tragic 6.0% |
| Arapaho | 0.0 /100 | #327 | Tragic 6.1% |
| Yuman | 0.0 /100 | #328 | Tragic 6.1% |
| Dominicans | 0.0 /100 | #329 | Tragic 6.2% |
| Alaska Natives | 0.0 /100 | #330 | Tragic 6.2% |
| Immigrants | Dominican Republic | 0.0 /100 | #331 | Tragic 6.3% |
| Aleuts | 0.0 /100 | #332 | Tragic 6.4% |