Immigrants from Brazil vs South American Unemployment Among Ages 20 to 24 years
COMPARE
Immigrants from Brazil
South American
Unemployment Among Ages 20 to 24 years
Unemployment Among Ages 20 to 24 years Comparison
Immigrants from Brazil
South Americans
10.1%
UNEMPLOYMENT AMONG AGES 20 TO 24 YEARS
84.9/ 100
METRIC RATING
128th/ 347
METRIC RANK
10.4%
UNEMPLOYMENT AMONG AGES 20 TO 24 YEARS
20.6/ 100
METRIC RATING
203rd/ 347
METRIC RANK
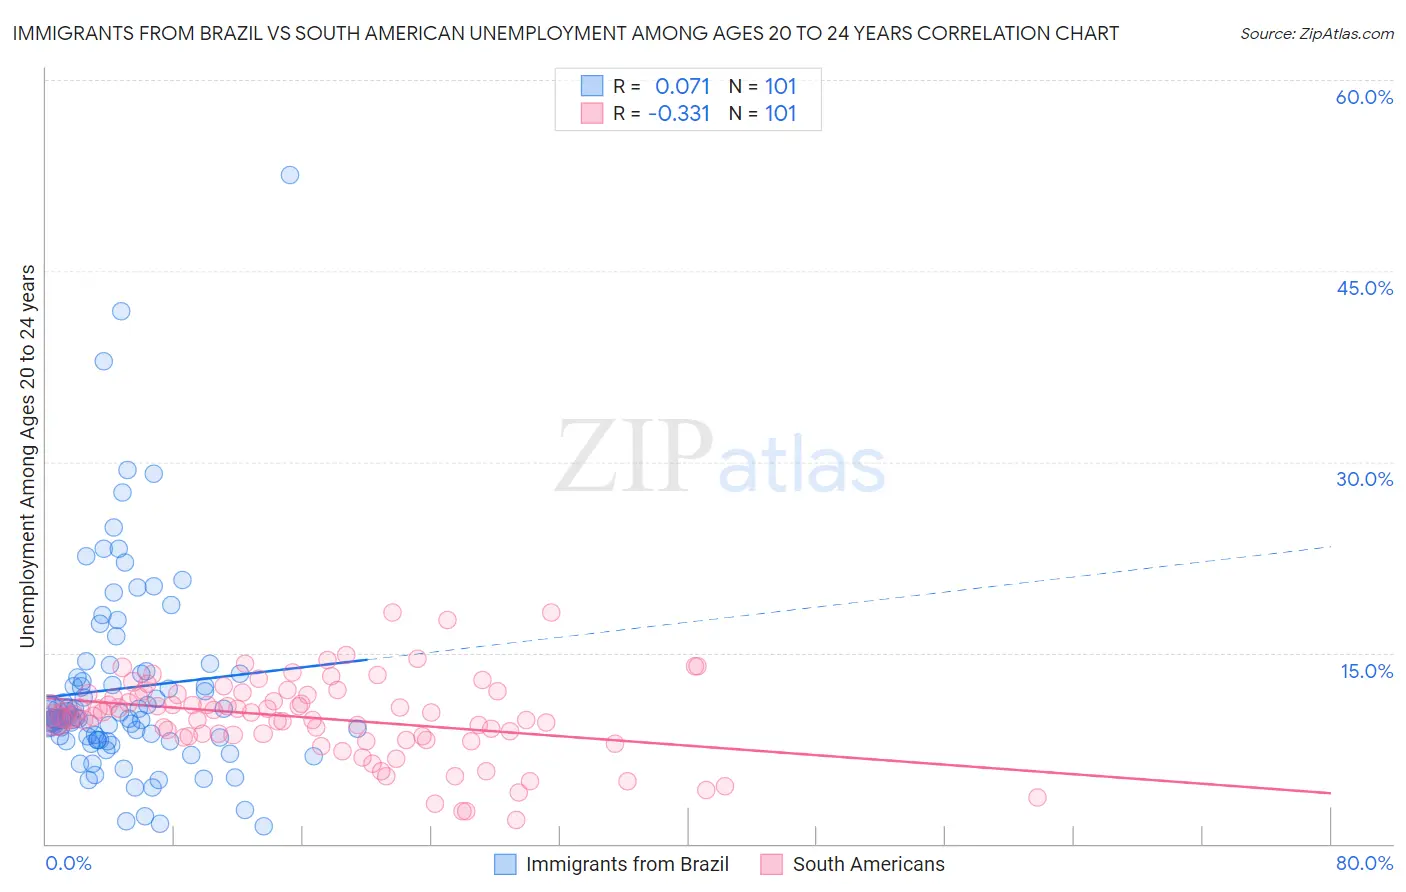
Immigrants from Brazil vs South American Unemployment Among Ages 20 to 24 years Correlation Chart
The statistical analysis conducted on geographies consisting of 335,197,013 people shows a slight positive correlation between the proportion of Immigrants from Brazil and unemployment rate among population between the ages 20 and 24 in the United States with a correlation coefficient (R) of 0.071 and weighted average of 10.1%. Similarly, the statistical analysis conducted on geographies consisting of 472,124,261 people shows a mild negative correlation between the proportion of South Americans and unemployment rate among population between the ages 20 and 24 in the United States with a correlation coefficient (R) of -0.331 and weighted average of 10.4%, a difference of 2.9%.
Unemployment Among Ages 20 to 24 years Correlation Summary
| Measurement | Immigrants from Brazil | South American |
| Minimum | 1.4% | 1.9% |
| Maximum | 52.5% | 18.2% |
| Range | 51.1% | 16.3% |
| Mean | 12.2% | 9.9% |
| Median | 9.8% | 10.1% |
| Interquartile 25% (IQ1) | 8.1% | 8.4% |
| Interquartile 75% (IQ3) | 13.4% | 11.8% |
| Interquartile Range (IQR) | 5.3% | 3.4% |
| Standard Deviation (Sample) | 8.1% | 3.2% |
| Standard Deviation (Population) | 8.0% | 3.2% |
Similar Demographics by Unemployment Among Ages 20 to 24 years
Demographics Similar to Immigrants from Brazil by Unemployment Among Ages 20 to 24 years
In terms of unemployment among ages 20 to 24 years, the demographic groups most similar to Immigrants from Brazil are Immigrants from South Central Asia (10.1%, a difference of 0.020%), Immigrants from Norway (10.1%, a difference of 0.030%), Immigrants from Lithuania (10.1%, a difference of 0.050%), Seminole (10.1%, a difference of 0.050%), and Immigrants from South Eastern Asia (10.1%, a difference of 0.060%).
| Demographics | Rating | Rank | Unemployment Among Ages 20 to 24 years |
| South Africans | 87.8 /100 | #121 | Excellent 10.1% |
| Whites/Caucasians | 87.4 /100 | #122 | Excellent 10.1% |
| Immigrants | Iraq | 87.1 /100 | #123 | Excellent 10.1% |
| Immigrants | Japan | 86.5 /100 | #124 | Excellent 10.1% |
| Spanish | 86.1 /100 | #125 | Excellent 10.1% |
| Jordanians | 86.1 /100 | #126 | Excellent 10.1% |
| Immigrants | Norway | 85.3 /100 | #127 | Excellent 10.1% |
| Immigrants | Brazil | 84.9 /100 | #128 | Excellent 10.1% |
| Immigrants | South Central Asia | 84.6 /100 | #129 | Excellent 10.1% |
| Immigrants | Lithuania | 84.2 /100 | #130 | Excellent 10.1% |
| Seminole | 84.2 /100 | #131 | Excellent 10.1% |
| Immigrants | South Eastern Asia | 84.0 /100 | #132 | Excellent 10.1% |
| Austrians | 83.9 /100 | #133 | Excellent 10.2% |
| Romanians | 83.8 /100 | #134 | Excellent 10.2% |
| Comanche | 83.4 /100 | #135 | Excellent 10.2% |
Demographics Similar to South Americans by Unemployment Among Ages 20 to 24 years
In terms of unemployment among ages 20 to 24 years, the demographic groups most similar to South Americans are Immigrants from Middle Africa (10.4%, a difference of 0.020%), Russian (10.4%, a difference of 0.040%), Immigrants from Peru (10.4%, a difference of 0.040%), Portuguese (10.4%, a difference of 0.060%), and Immigrants from Northern Europe (10.4%, a difference of 0.060%).
| Demographics | Rating | Rank | Unemployment Among Ages 20 to 24 years |
| Immigrants | Philippines | 24.1 /100 | #196 | Fair 10.4% |
| Immigrants | Denmark | 22.8 /100 | #197 | Fair 10.4% |
| Colombians | 22.3 /100 | #198 | Fair 10.4% |
| Portuguese | 21.8 /100 | #199 | Fair 10.4% |
| Russians | 21.2 /100 | #200 | Fair 10.4% |
| Immigrants | Peru | 21.2 /100 | #201 | Fair 10.4% |
| Immigrants | Middle Africa | 20.9 /100 | #202 | Fair 10.4% |
| South Americans | 20.6 /100 | #203 | Fair 10.4% |
| Immigrants | Northern Europe | 19.5 /100 | #204 | Poor 10.4% |
| Cypriots | 18.9 /100 | #205 | Poor 10.4% |
| Immigrants | Europe | 18.5 /100 | #206 | Poor 10.4% |
| Immigrants | Honduras | 17.9 /100 | #207 | Poor 10.4% |
| Immigrants | Hong Kong | 17.6 /100 | #208 | Poor 10.5% |
| Peruvians | 17.2 /100 | #209 | Poor 10.5% |
| Immigrants | Belgium | 16.9 /100 | #210 | Poor 10.5% |