Immigrants from Brazil vs Immigrants from Peru Unemployment Among Seniors over 65 years
COMPARE
Immigrants from Brazil
Immigrants from Peru
Unemployment Among Seniors over 65 years
Unemployment Among Seniors over 65 years Comparison
Immigrants from Brazil
Immigrants from Peru
5.4%
UNEMPLOYMENT AMONG SENIORS OVER 65 YEARS
0.1/ 100
METRIC RATING
274th/ 347
METRIC RANK
5.4%
UNEMPLOYMENT AMONG SENIORS OVER 65 YEARS
0.5/ 100
METRIC RATING
255th/ 347
METRIC RANK
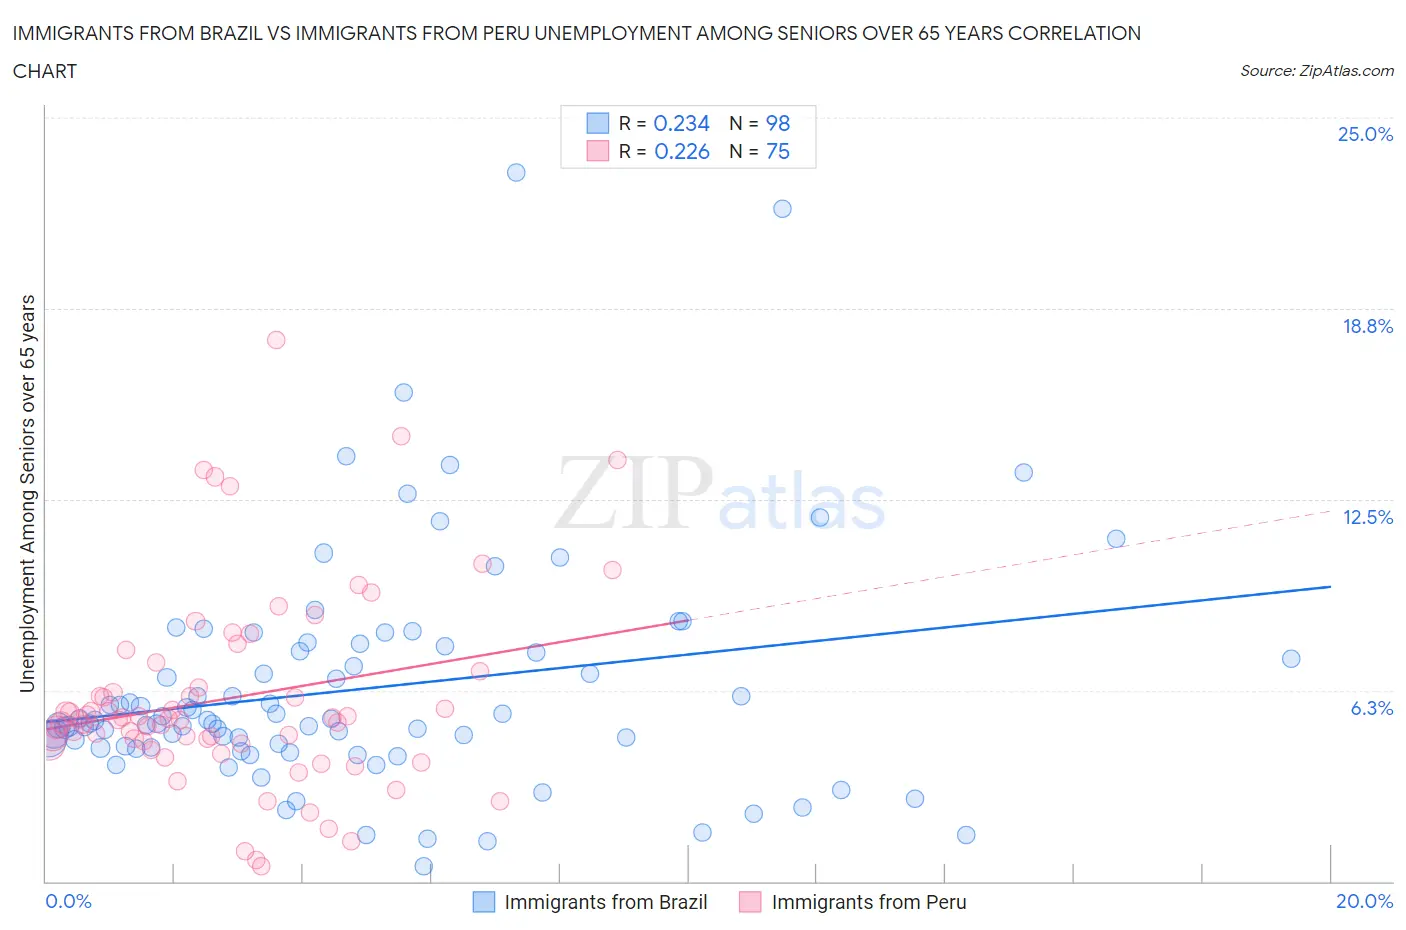
Immigrants from Brazil vs Immigrants from Peru Unemployment Among Seniors over 65 years Correlation Chart
The statistical analysis conducted on geographies consisting of 316,177,554 people shows a weak positive correlation between the proportion of Immigrants from Brazil and unemployment rate amomg seniors over the age of 65 in the United States with a correlation coefficient (R) of 0.234 and weighted average of 5.4%. Similarly, the statistical analysis conducted on geographies consisting of 305,441,687 people shows a weak positive correlation between the proportion of Immigrants from Peru and unemployment rate amomg seniors over the age of 65 in the United States with a correlation coefficient (R) of 0.226 and weighted average of 5.4%, a difference of 1.2%.
Unemployment Among Seniors over 65 years Correlation Summary
| Measurement | Immigrants from Brazil | Immigrants from Peru |
| Minimum | 0.50% | 0.50% |
| Maximum | 23.2% | 17.7% |
| Range | 22.7% | 17.2% |
| Mean | 6.3% | 6.0% |
| Median | 5.2% | 5.3% |
| Interquartile 25% (IQ1) | 4.4% | 4.5% |
| Interquartile 75% (IQ3) | 7.5% | 6.9% |
| Interquartile Range (IQR) | 3.2% | 2.3% |
| Standard Deviation (Sample) | 3.8% | 3.2% |
| Standard Deviation (Population) | 3.8% | 3.2% |
Demographics Similar to Immigrants from Brazil and Immigrants from Peru by Unemployment Among Seniors over 65 years
In terms of unemployment among seniors over 65 years, the demographic groups most similar to Immigrants from Brazil are Immigrants from Nigeria (5.4%, a difference of 0.040%), Cypriot (5.4%, a difference of 0.050%), Immigrants from Jamaica (5.4%, a difference of 0.050%), Immigrants from Morocco (5.4%, a difference of 0.070%), and Immigrants from Southern Europe (5.4%, a difference of 0.13%). Similarly, the demographic groups most similar to Immigrants from Peru are Paraguayan (5.4%, a difference of 0.010%), Moroccan (5.4%, a difference of 0.030%), Immigrants from Micronesia (5.4%, a difference of 0.12%), Sierra Leonean (5.4%, a difference of 0.19%), and Immigrants from Ghana (5.4%, a difference of 0.27%).
| Demographics | Rating | Rank | Unemployment Among Seniors over 65 years |
| Paraguayans | 0.5 /100 | #254 | Tragic 5.4% |
| Immigrants | Peru | 0.5 /100 | #255 | Tragic 5.4% |
| Moroccans | 0.5 /100 | #256 | Tragic 5.4% |
| Immigrants | Micronesia | 0.4 /100 | #257 | Tragic 5.4% |
| Sierra Leoneans | 0.4 /100 | #258 | Tragic 5.4% |
| Immigrants | Ghana | 0.4 /100 | #259 | Tragic 5.4% |
| Native Hawaiians | 0.3 /100 | #260 | Tragic 5.4% |
| Spanish American Indians | 0.2 /100 | #261 | Tragic 5.4% |
| Immigrants | Grenada | 0.2 /100 | #262 | Tragic 5.4% |
| South Americans | 0.2 /100 | #263 | Tragic 5.4% |
| Central American Indians | 0.2 /100 | #264 | Tragic 5.4% |
| Immigrants | Colombia | 0.2 /100 | #265 | Tragic 5.4% |
| Pennsylvania Germans | 0.2 /100 | #266 | Tragic 5.4% |
| Chippewa | 0.2 /100 | #267 | Tragic 5.4% |
| Hawaiians | 0.1 /100 | #268 | Tragic 5.4% |
| Immigrants | Southern Europe | 0.1 /100 | #269 | Tragic 5.4% |
| Immigrants | Morocco | 0.1 /100 | #270 | Tragic 5.4% |
| Cypriots | 0.1 /100 | #271 | Tragic 5.4% |
| Immigrants | Jamaica | 0.1 /100 | #272 | Tragic 5.4% |
| Immigrants | Nigeria | 0.1 /100 | #273 | Tragic 5.4% |
| Immigrants | Brazil | 0.1 /100 | #274 | Tragic 5.4% |