Immigrants from Brazil vs Eastern European Unemployment Among Seniors over 75 years
COMPARE
Immigrants from Brazil
Eastern European
Unemployment Among Seniors over 75 years
Unemployment Among Seniors over 75 years Comparison
Immigrants from Brazil
Eastern Europeans
9.0%
UNEMPLOYMENT AMONG SENIORS OVER 75 YEARS
13.3/ 100
METRIC RATING
214th/ 347
METRIC RANK
8.9%
UNEMPLOYMENT AMONG SENIORS OVER 75 YEARS
25.9/ 100
METRIC RATING
198th/ 347
METRIC RANK
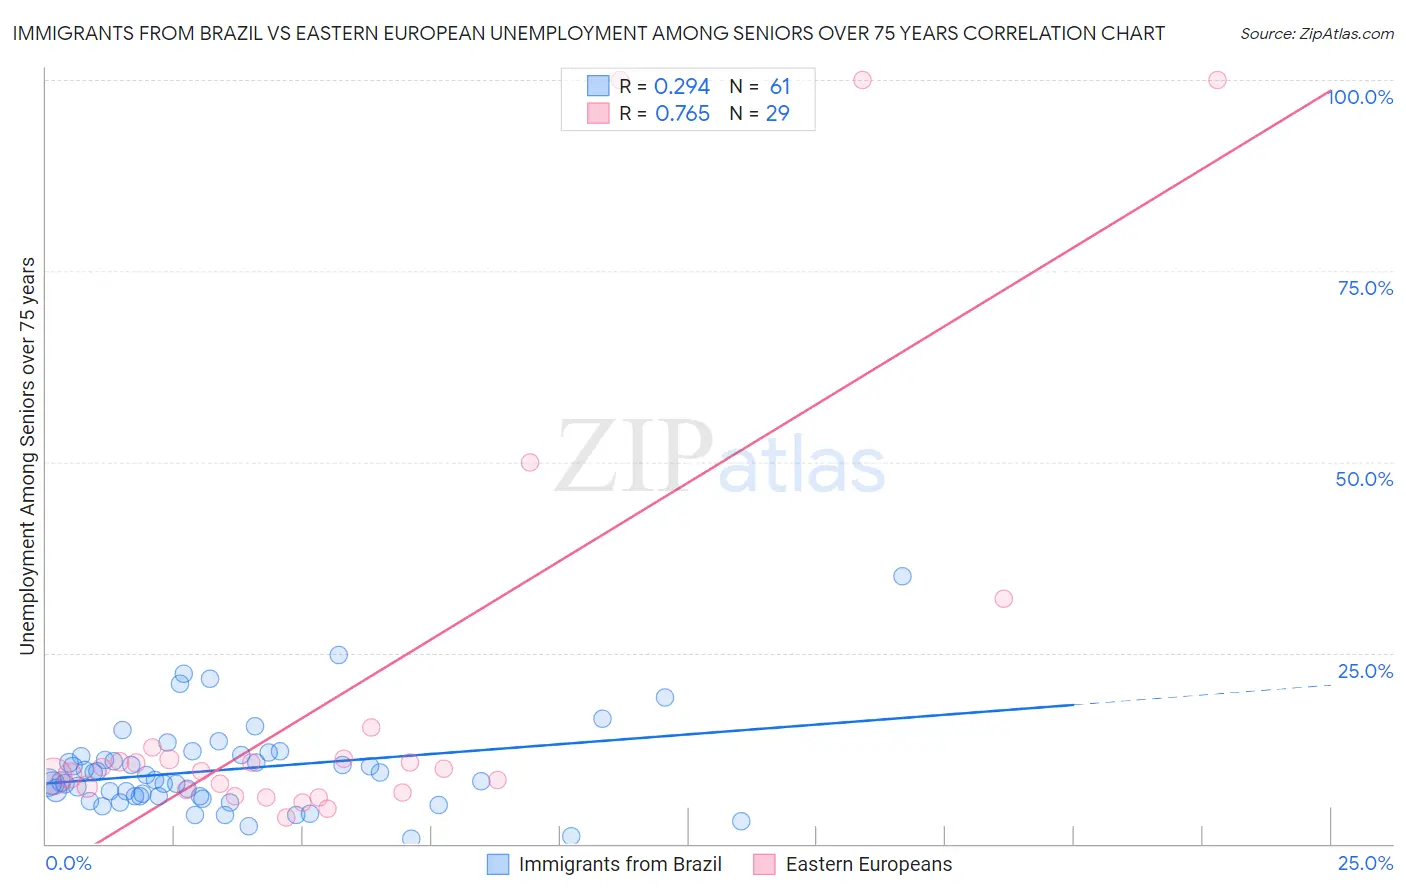
Immigrants from Brazil vs Eastern European Unemployment Among Seniors over 75 years Correlation Chart
The statistical analysis conducted on geographies consisting of 186,404,658 people shows a weak positive correlation between the proportion of Immigrants from Brazil and unemployment rate among seniors over the age of 75 in the United States with a correlation coefficient (R) of 0.294 and weighted average of 9.0%. Similarly, the statistical analysis conducted on geographies consisting of 215,989,607 people shows a strong positive correlation between the proportion of Eastern Europeans and unemployment rate among seniors over the age of 75 in the United States with a correlation coefficient (R) of 0.765 and weighted average of 8.9%, a difference of 1.1%.
Unemployment Among Seniors over 75 years Correlation Summary
| Measurement | Immigrants from Brazil | Eastern European |
| Minimum | 0.60% | 3.4% |
| Maximum | 35.1% | 100.0% |
| Range | 34.5% | 96.6% |
| Mean | 9.7% | 20.4% |
| Median | 8.2% | 9.8% |
| Interquartile 25% (IQ1) | 6.2% | 6.9% |
| Interquartile 75% (IQ3) | 11.5% | 11.9% |
| Interquartile Range (IQR) | 5.3% | 5.0% |
| Standard Deviation (Sample) | 6.0% | 29.0% |
| Standard Deviation (Population) | 6.0% | 28.5% |
Demographics Similar to Immigrants from Brazil and Eastern Europeans by Unemployment Among Seniors over 75 years
In terms of unemployment among seniors over 75 years, the demographic groups most similar to Immigrants from Brazil are Immigrants from Latin America (9.0%, a difference of 0.020%), Romanian (9.0%, a difference of 0.050%), Immigrants from Western Asia (9.0%, a difference of 0.090%), Delaware (9.0%, a difference of 0.14%), and Immigrants from Oceania (9.0%, a difference of 0.18%). Similarly, the demographic groups most similar to Eastern Europeans are Immigrants from Laos (8.9%, a difference of 0.030%), Pakistani (8.9%, a difference of 0.030%), Osage (8.9%, a difference of 0.030%), Immigrants from Peru (8.9%, a difference of 0.11%), and Immigrants from Jamaica (8.9%, a difference of 0.12%).
| Demographics | Rating | Rank | Unemployment Among Seniors over 75 years |
| Immigrants | Jamaica | 27.7 /100 | #196 | Fair 8.9% |
| Immigrants | Laos | 26.3 /100 | #197 | Fair 8.9% |
| Eastern Europeans | 25.9 /100 | #198 | Fair 8.9% |
| Pakistanis | 25.4 /100 | #199 | Fair 8.9% |
| Osage | 25.4 /100 | #200 | Fair 8.9% |
| Immigrants | Peru | 24.3 /100 | #201 | Fair 8.9% |
| Russians | 24.1 /100 | #202 | Fair 8.9% |
| Immigrants | Northern Europe | 23.9 /100 | #203 | Fair 8.9% |
| Spaniards | 22.0 /100 | #204 | Fair 8.9% |
| Koreans | 21.9 /100 | #205 | Fair 8.9% |
| Immigrants | Western Europe | 18.2 /100 | #206 | Poor 8.9% |
| Malaysians | 16.3 /100 | #207 | Poor 8.9% |
| Immigrants | Philippines | 15.8 /100 | #208 | Poor 8.9% |
| Salvadorans | 15.4 /100 | #209 | Poor 8.9% |
| Bermudans | 15.0 /100 | #210 | Poor 8.9% |
| Delaware | 14.6 /100 | #211 | Poor 9.0% |
| Romanians | 13.8 /100 | #212 | Poor 9.0% |
| Immigrants | Latin America | 13.4 /100 | #213 | Poor 9.0% |
| Immigrants | Brazil | 13.3 /100 | #214 | Poor 9.0% |
| Immigrants | Western Asia | 12.5 /100 | #215 | Poor 9.0% |
| Immigrants | Oceania | 11.8 /100 | #216 | Poor 9.0% |