Immigrants from Bosnia and Herzegovina vs Honduran Unemployment Among Ages 30 to 34 years
COMPARE
Immigrants from Bosnia and Herzegovina
Honduran
Unemployment Among Ages 30 to 34 years
Unemployment Among Ages 30 to 34 years Comparison
Immigrants from Bosnia and Herzegovina
Hondurans
4.7%
UNEMPLOYMENT AMONG AGES 30 TO 34 YEARS
100.0/ 100
METRIC RATING
6th/ 347
METRIC RANK
6.0%
UNEMPLOYMENT AMONG AGES 30 TO 34 YEARS
0.3/ 100
METRIC RATING
249th/ 347
METRIC RANK
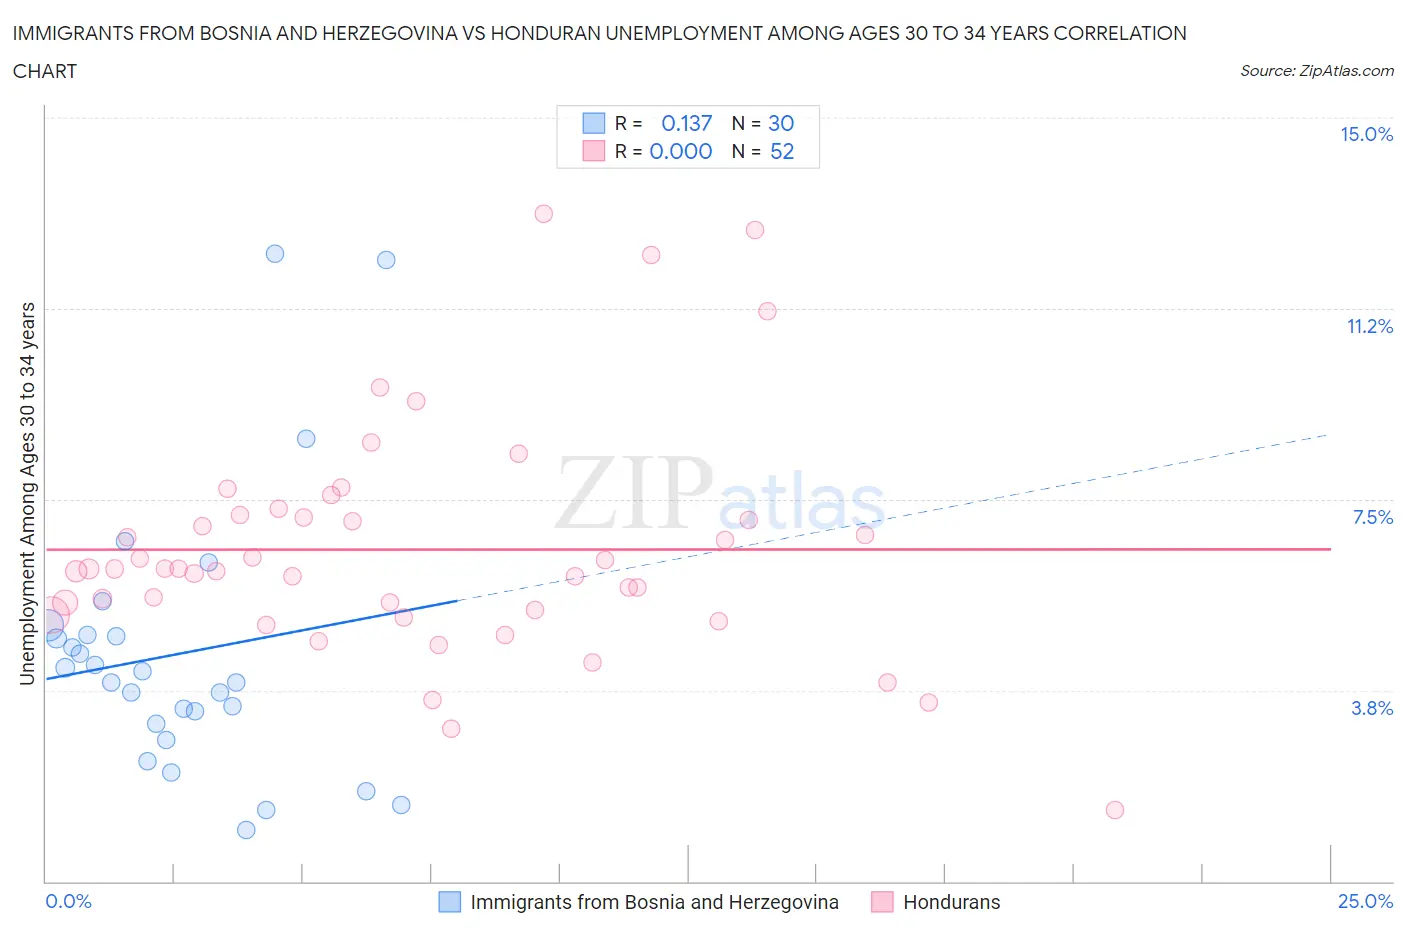
Immigrants from Bosnia and Herzegovina vs Honduran Unemployment Among Ages 30 to 34 years Correlation Chart
The statistical analysis conducted on geographies consisting of 152,450,998 people shows a poor positive correlation between the proportion of Immigrants from Bosnia and Herzegovina and unemployment rate among population between the ages 30 and 34 in the United States with a correlation coefficient (R) of 0.137 and weighted average of 4.7%. Similarly, the statistical analysis conducted on geographies consisting of 342,831,015 people shows no correlation between the proportion of Hondurans and unemployment rate among population between the ages 30 and 34 in the United States with a correlation coefficient (R) of 0.000 and weighted average of 6.0%, a difference of 27.7%.
Unemployment Among Ages 30 to 34 years Correlation Summary
| Measurement | Immigrants from Bosnia and Herzegovina | Honduran |
| Minimum | 1.0% | 1.4% |
| Maximum | 12.3% | 13.1% |
| Range | 11.3% | 11.7% |
| Mean | 4.5% | 6.5% |
| Median | 4.0% | 6.1% |
| Interquartile 25% (IQ1) | 3.1% | 5.3% |
| Interquartile 75% (IQ3) | 4.8% | 7.2% |
| Interquartile Range (IQR) | 1.7% | 1.9% |
| Standard Deviation (Sample) | 2.7% | 2.3% |
| Standard Deviation (Population) | 2.6% | 2.3% |
Similar Demographics by Unemployment Among Ages 30 to 34 years
Demographics Similar to Immigrants from Bosnia and Herzegovina by Unemployment Among Ages 30 to 34 years
In terms of unemployment among ages 30 to 34 years, the demographic groups most similar to Immigrants from Bosnia and Herzegovina are Thai (4.7%, a difference of 0.20%), Venezuelan (4.7%, a difference of 0.23%), Immigrants from Eritrea (4.7%, a difference of 0.38%), Bulgarian (4.7%, a difference of 0.69%), and Immigrants from Nepal (4.7%, a difference of 0.87%).
| Demographics | Rating | Rank | Unemployment Among Ages 30 to 34 years |
| Immigrants | India | 100.0 /100 | #1 | Exceptional 4.5% |
| Sudanese | 100.0 /100 | #2 | Exceptional 4.6% |
| Immigrants | Venezuela | 100.0 /100 | #3 | Exceptional 4.6% |
| Immigrants | Nepal | 100.0 /100 | #4 | Exceptional 4.7% |
| Venezuelans | 100.0 /100 | #5 | Exceptional 4.7% |
| Immigrants | Bosnia and Herzegovina | 100.0 /100 | #6 | Exceptional 4.7% |
| Thais | 100.0 /100 | #7 | Exceptional 4.7% |
| Immigrants | Eritrea | 100.0 /100 | #8 | Exceptional 4.7% |
| Bulgarians | 99.9 /100 | #9 | Exceptional 4.7% |
| Tongans | 99.9 /100 | #10 | Exceptional 4.8% |
| Immigrants | Bolivia | 99.9 /100 | #11 | Exceptional 4.8% |
| Filipinos | 99.9 /100 | #12 | Exceptional 4.8% |
| Cambodians | 99.9 /100 | #13 | Exceptional 4.8% |
| Luxembourgers | 99.9 /100 | #14 | Exceptional 4.8% |
| Okinawans | 99.9 /100 | #15 | Exceptional 4.8% |
Demographics Similar to Hondurans by Unemployment Among Ages 30 to 34 years
In terms of unemployment among ages 30 to 34 years, the demographic groups most similar to Hondurans are Immigrants from Guatemala (6.0%, a difference of 0.0%), Nigerian (6.0%, a difference of 0.010%), Ghanaian (6.0%, a difference of 0.070%), Immigrants from Honduras (6.0%, a difference of 0.090%), and Subsaharan African (6.0%, a difference of 0.25%).
| Demographics | Rating | Rank | Unemployment Among Ages 30 to 34 years |
| Guatemalans | 0.4 /100 | #242 | Tragic 6.0% |
| Immigrants | Liberia | 0.4 /100 | #243 | Tragic 6.0% |
| Immigrants | Micronesia | 0.3 /100 | #244 | Tragic 6.0% |
| Sub-Saharan Africans | 0.3 /100 | #245 | Tragic 6.0% |
| Ghanaians | 0.3 /100 | #246 | Tragic 6.0% |
| Nigerians | 0.3 /100 | #247 | Tragic 6.0% |
| Immigrants | Guatemala | 0.3 /100 | #248 | Tragic 6.0% |
| Hondurans | 0.3 /100 | #249 | Tragic 6.0% |
| Immigrants | Honduras | 0.3 /100 | #250 | Tragic 6.0% |
| Tlingit-Haida | 0.2 /100 | #251 | Tragic 6.0% |
| Potawatomi | 0.2 /100 | #252 | Tragic 6.0% |
| Immigrants | Nonimmigrants | 0.2 /100 | #253 | Tragic 6.1% |
| Armenians | 0.1 /100 | #254 | Tragic 6.1% |
| Immigrants | Portugal | 0.1 /100 | #255 | Tragic 6.1% |
| Immigrants | Ghana | 0.1 /100 | #256 | Tragic 6.1% |