Immigrants from Bolivia vs Immigrants from Latin America Unemployment Among Seniors over 75 years
COMPARE
Immigrants from Bolivia
Immigrants from Latin America
Unemployment Among Seniors over 75 years
Unemployment Among Seniors over 75 years Comparison
Immigrants from Bolivia
Immigrants from Latin America
8.5%
UNEMPLOYMENT AMONG SENIORS OVER 75 YEARS
87.9/ 100
METRIC RATING
141st/ 347
METRIC RANK
9.0%
UNEMPLOYMENT AMONG SENIORS OVER 75 YEARS
13.4/ 100
METRIC RATING
213th/ 347
METRIC RANK
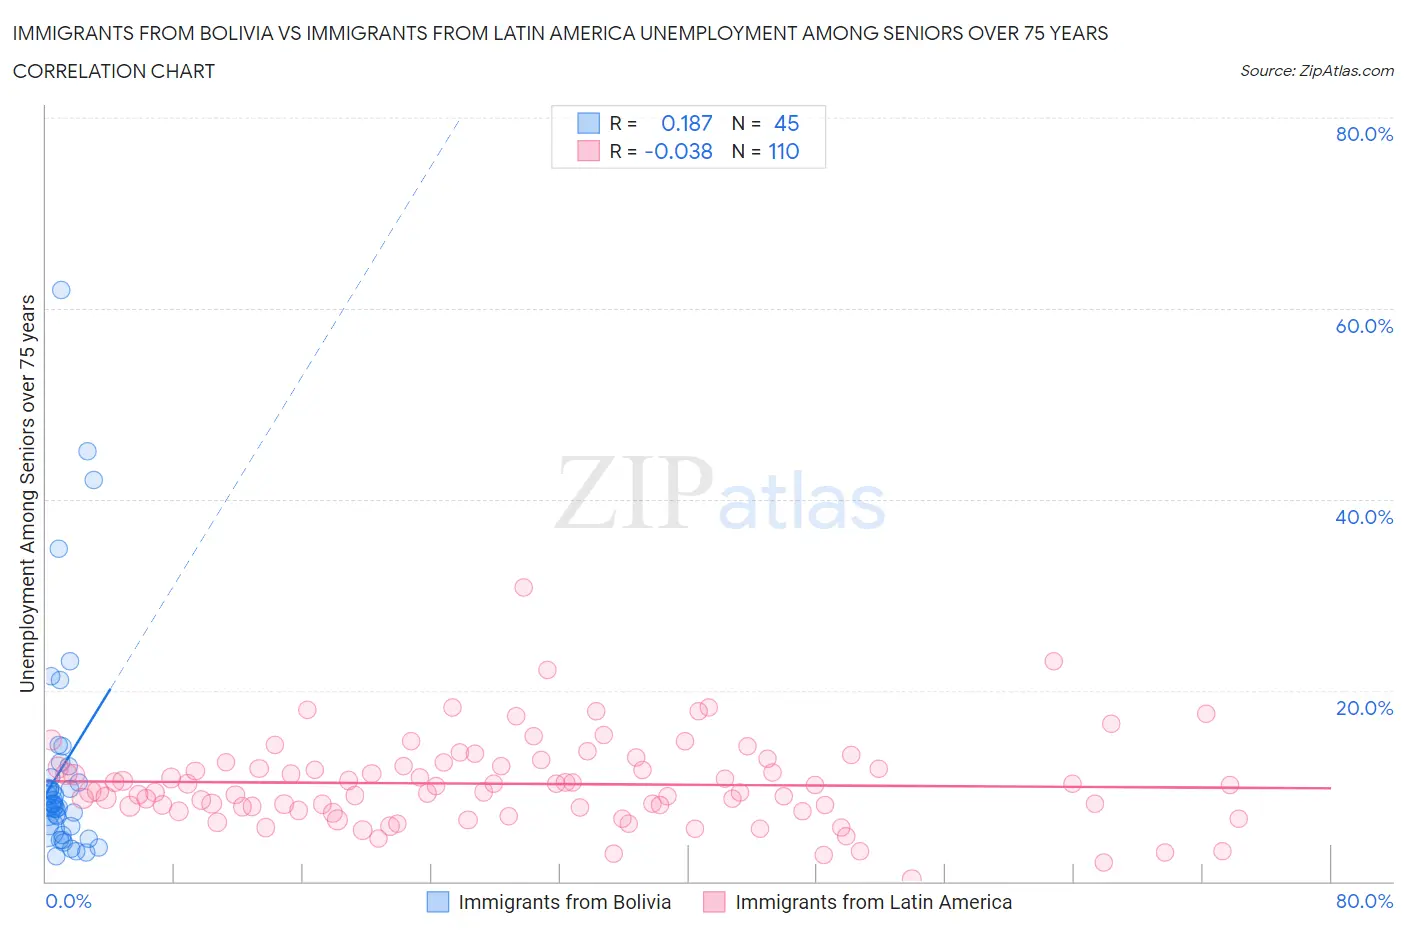
Immigrants from Bolivia vs Immigrants from Latin America Unemployment Among Seniors over 75 years Correlation Chart
The statistical analysis conducted on geographies consisting of 109,002,888 people shows a poor positive correlation between the proportion of Immigrants from Bolivia and unemployment rate among seniors over the age of 75 in the United States with a correlation coefficient (R) of 0.187 and weighted average of 8.5%. Similarly, the statistical analysis conducted on geographies consisting of 234,389,165 people shows no correlation between the proportion of Immigrants from Latin America and unemployment rate among seniors over the age of 75 in the United States with a correlation coefficient (R) of -0.038 and weighted average of 9.0%, a difference of 5.3%.
Unemployment Among Seniors over 75 years Correlation Summary
| Measurement | Immigrants from Bolivia | Immigrants from Latin America |
| Minimum | 2.6% | 0.20% |
| Maximum | 61.9% | 30.8% |
| Range | 59.3% | 30.6% |
| Mean | 11.9% | 10.2% |
| Median | 8.1% | 9.7% |
| Interquartile 25% (IQ1) | 5.6% | 7.8% |
| Interquartile 75% (IQ3) | 11.5% | 12.1% |
| Interquartile Range (IQR) | 5.8% | 4.3% |
| Standard Deviation (Sample) | 12.1% | 4.6% |
| Standard Deviation (Population) | 11.9% | 4.6% |
Similar Demographics by Unemployment Among Seniors over 75 years
Demographics Similar to Immigrants from Bolivia by Unemployment Among Seniors over 75 years
In terms of unemployment among seniors over 75 years, the demographic groups most similar to Immigrants from Bolivia are South American (8.5%, a difference of 0.0%), Barbadian (8.5%, a difference of 0.090%), Immigrants from Ukraine (8.5%, a difference of 0.11%), Immigrants from Costa Rica (8.5%, a difference of 0.14%), and Colombian (8.5%, a difference of 0.15%).
| Demographics | Rating | Rank | Unemployment Among Seniors over 75 years |
| Immigrants | Czechoslovakia | 93.4 /100 | #134 | Exceptional 8.4% |
| Haitians | 91.4 /100 | #135 | Exceptional 8.5% |
| Immigrants | Trinidad and Tobago | 90.8 /100 | #136 | Exceptional 8.5% |
| Immigrants | Kuwait | 90.5 /100 | #137 | Exceptional 8.5% |
| Immigrants | Bulgaria | 89.6 /100 | #138 | Excellent 8.5% |
| Barbadians | 88.6 /100 | #139 | Excellent 8.5% |
| South Americans | 87.9 /100 | #140 | Excellent 8.5% |
| Immigrants | Bolivia | 87.9 /100 | #141 | Excellent 8.5% |
| Immigrants | Ukraine | 87.0 /100 | #142 | Excellent 8.5% |
| Immigrants | Costa Rica | 86.8 /100 | #143 | Excellent 8.5% |
| Colombians | 86.7 /100 | #144 | Excellent 8.5% |
| Immigrants | Romania | 86.2 /100 | #145 | Excellent 8.5% |
| Immigrants | South Eastern Asia | 85.8 /100 | #146 | Excellent 8.5% |
| Immigrants | Sierra Leone | 85.6 /100 | #147 | Excellent 8.5% |
| Immigrants | Colombia | 85.6 /100 | #148 | Excellent 8.5% |
Demographics Similar to Immigrants from Latin America by Unemployment Among Seniors over 75 years
In terms of unemployment among seniors over 75 years, the demographic groups most similar to Immigrants from Latin America are Immigrants from Brazil (9.0%, a difference of 0.020%), Romanian (9.0%, a difference of 0.040%), Immigrants from Western Asia (9.0%, a difference of 0.11%), Delaware (9.0%, a difference of 0.12%), and Bermudan (8.9%, a difference of 0.17%).
| Demographics | Rating | Rank | Unemployment Among Seniors over 75 years |
| Immigrants | Western Europe | 18.2 /100 | #206 | Poor 8.9% |
| Malaysians | 16.3 /100 | #207 | Poor 8.9% |
| Immigrants | Philippines | 15.8 /100 | #208 | Poor 8.9% |
| Salvadorans | 15.4 /100 | #209 | Poor 8.9% |
| Bermudans | 15.0 /100 | #210 | Poor 8.9% |
| Delaware | 14.6 /100 | #211 | Poor 9.0% |
| Romanians | 13.8 /100 | #212 | Poor 9.0% |
| Immigrants | Latin America | 13.4 /100 | #213 | Poor 9.0% |
| Immigrants | Brazil | 13.3 /100 | #214 | Poor 9.0% |
| Immigrants | Western Asia | 12.5 /100 | #215 | Poor 9.0% |
| Immigrants | Oceania | 11.8 /100 | #216 | Poor 9.0% |
| Lebanese | 11.1 /100 | #217 | Poor 9.0% |
| Immigrants | Africa | 9.7 /100 | #218 | Tragic 9.0% |
| Afghans | 8.3 /100 | #219 | Tragic 9.0% |
| Immigrants | Zimbabwe | 7.8 /100 | #220 | Tragic 9.0% |