Immigrants from Belize vs Immigrants from Pakistan Unemployment Among Ages 65 to 74 years
COMPARE
Immigrants from Belize
Immigrants from Pakistan
Unemployment Among Ages 65 to 74 years
Unemployment Among Ages 65 to 74 years Comparison
Immigrants from Belize
Immigrants from Pakistan
5.5%
UNEMPLOYMENT AMONG AGES 65 TO 74 YEARS
2.2/ 100
METRIC RATING
237th/ 347
METRIC RANK
5.4%
UNEMPLOYMENT AMONG AGES 65 TO 74 YEARS
15.2/ 100
METRIC RATING
200th/ 347
METRIC RANK
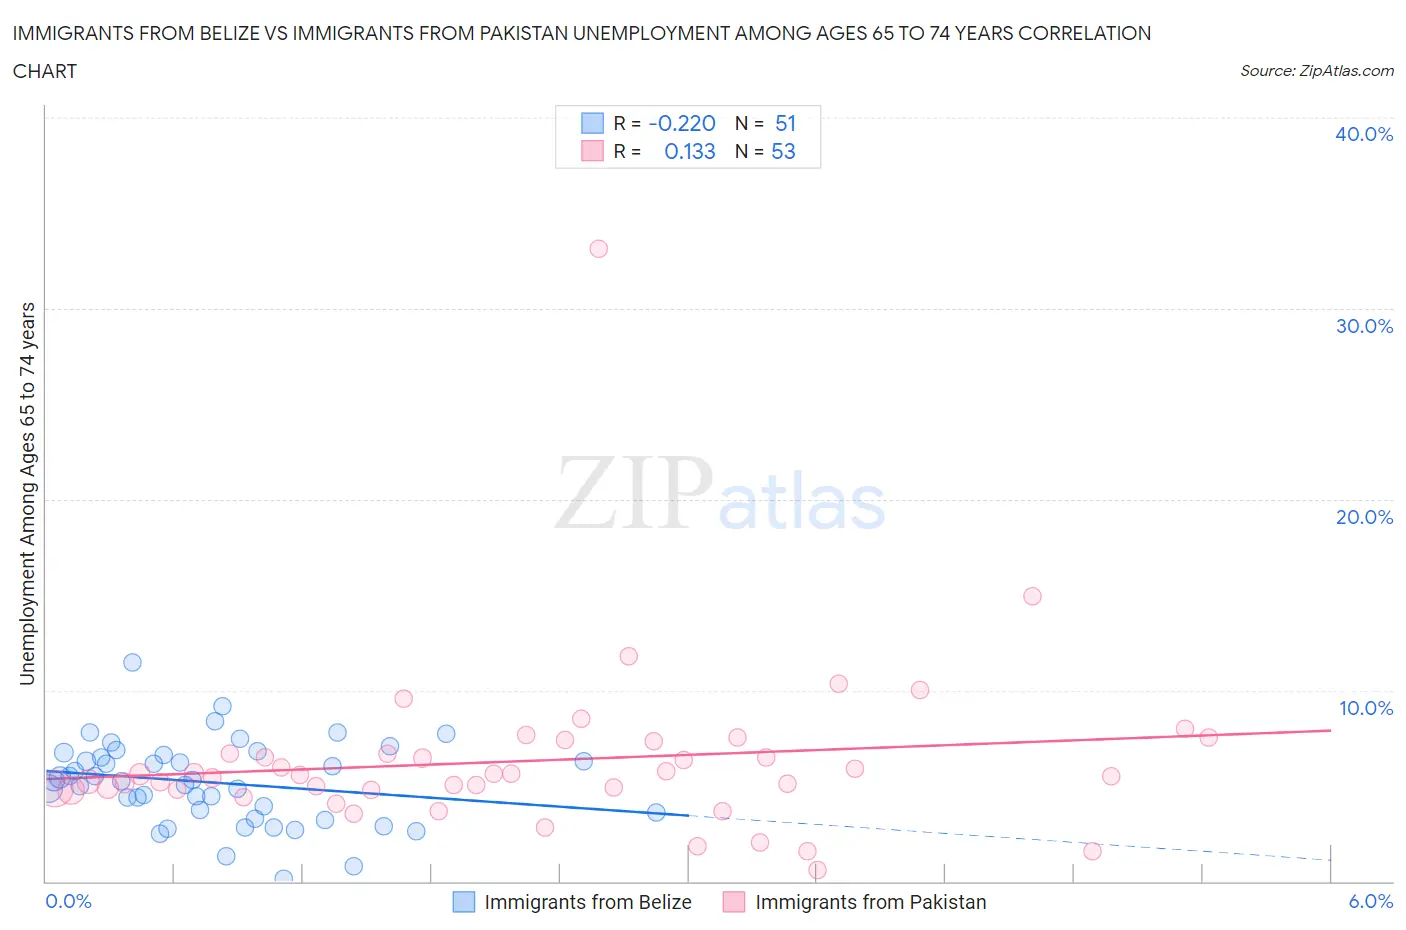
Immigrants from Belize vs Immigrants from Pakistan Unemployment Among Ages 65 to 74 years Correlation Chart
The statistical analysis conducted on geographies consisting of 124,538,788 people shows a weak negative correlation between the proportion of Immigrants from Belize and unemployment rate among population between the ages 65 and 74 in the United States with a correlation coefficient (R) of -0.220 and weighted average of 5.5%. Similarly, the statistical analysis conducted on geographies consisting of 261,599,137 people shows a poor positive correlation between the proportion of Immigrants from Pakistan and unemployment rate among population between the ages 65 and 74 in the United States with a correlation coefficient (R) of 0.133 and weighted average of 5.4%, a difference of 1.7%.
Unemployment Among Ages 65 to 74 years Correlation Summary
| Measurement | Immigrants from Belize | Immigrants from Pakistan |
| Minimum | 0.10% | 0.60% |
| Maximum | 11.4% | 33.1% |
| Range | 11.3% | 32.5% |
| Mean | 5.2% | 6.3% |
| Median | 5.3% | 5.6% |
| Interquartile 25% (IQ1) | 3.6% | 4.8% |
| Interquartile 75% (IQ3) | 6.6% | 7.0% |
| Interquartile Range (IQR) | 3.0% | 2.2% |
| Standard Deviation (Sample) | 2.2% | 4.5% |
| Standard Deviation (Population) | 2.2% | 4.5% |
Similar Demographics by Unemployment Among Ages 65 to 74 years
Demographics Similar to Immigrants from Belize by Unemployment Among Ages 65 to 74 years
In terms of unemployment among ages 65 to 74 years, the demographic groups most similar to Immigrants from Belize are Hopi (5.5%, a difference of 0.0%), Peruvian (5.5%, a difference of 0.010%), French American Indian (5.5%, a difference of 0.020%), South American Indian (5.5%, a difference of 0.030%), and Nigerian (5.5%, a difference of 0.12%).
| Demographics | Rating | Rank | Unemployment Among Ages 65 to 74 years |
| Immigrants | Caribbean | 2.7 /100 | #230 | Tragic 5.5% |
| Israelis | 2.5 /100 | #231 | Tragic 5.5% |
| Nigerians | 2.5 /100 | #232 | Tragic 5.5% |
| South American Indians | 2.3 /100 | #233 | Tragic 5.5% |
| French American Indians | 2.2 /100 | #234 | Tragic 5.5% |
| Peruvians | 2.2 /100 | #235 | Tragic 5.5% |
| Hopi | 2.2 /100 | #236 | Tragic 5.5% |
| Immigrants | Belize | 2.2 /100 | #237 | Tragic 5.5% |
| Cajuns | 1.8 /100 | #238 | Tragic 5.5% |
| German Russians | 1.6 /100 | #239 | Tragic 5.5% |
| Ghanaians | 1.4 /100 | #240 | Tragic 5.6% |
| Cree | 1.4 /100 | #241 | Tragic 5.6% |
| Immigrants | Ghana | 1.4 /100 | #242 | Tragic 5.6% |
| Immigrants | Peru | 1.3 /100 | #243 | Tragic 5.6% |
| Immigrants | Micronesia | 0.9 /100 | #244 | Tragic 5.6% |
Demographics Similar to Immigrants from Pakistan by Unemployment Among Ages 65 to 74 years
In terms of unemployment among ages 65 to 74 years, the demographic groups most similar to Immigrants from Pakistan are Immigrants from Western Asia (5.4%, a difference of 0.020%), Immigrants from Belgium (5.4%, a difference of 0.060%), Subsaharan African (5.4%, a difference of 0.060%), Argentinean (5.4%, a difference of 0.060%), and Seminole (5.4%, a difference of 0.060%).
| Demographics | Rating | Rank | Unemployment Among Ages 65 to 74 years |
| Cherokee | 25.8 /100 | #193 | Fair 5.4% |
| Immigrants | Denmark | 24.7 /100 | #194 | Fair 5.4% |
| Immigrants | China | 24.2 /100 | #195 | Fair 5.4% |
| Costa Ricans | 21.1 /100 | #196 | Fair 5.4% |
| Colville | 20.4 /100 | #197 | Fair 5.4% |
| Albanians | 17.8 /100 | #198 | Poor 5.4% |
| Immigrants | Belgium | 16.2 /100 | #199 | Poor 5.4% |
| Immigrants | Pakistan | 15.2 /100 | #200 | Poor 5.4% |
| Immigrants | Western Asia | 14.9 /100 | #201 | Poor 5.4% |
| Sub-Saharan Africans | 14.4 /100 | #202 | Poor 5.4% |
| Argentineans | 14.3 /100 | #203 | Poor 5.4% |
| Seminole | 14.3 /100 | #204 | Poor 5.4% |
| Icelanders | 14.2 /100 | #205 | Poor 5.4% |
| Africans | 12.8 /100 | #206 | Poor 5.5% |
| Immigrants | Uzbekistan | 12.5 /100 | #207 | Poor 5.5% |