Immigrants from Belgium vs Argentinean Unemployment Among Seniors over 65 years
COMPARE
Immigrants from Belgium
Argentinean
Unemployment Among Seniors over 65 years
Unemployment Among Seniors over 65 years Comparison
Immigrants from Belgium
Argentineans
5.2%
UNEMPLOYMENT AMONG SENIORS OVER 65 YEARS
44.8/ 100
METRIC RATING
178th/ 347
METRIC RANK
5.2%
UNEMPLOYMENT AMONG SENIORS OVER 65 YEARS
29.1/ 100
METRIC RATING
194th/ 347
METRIC RANK
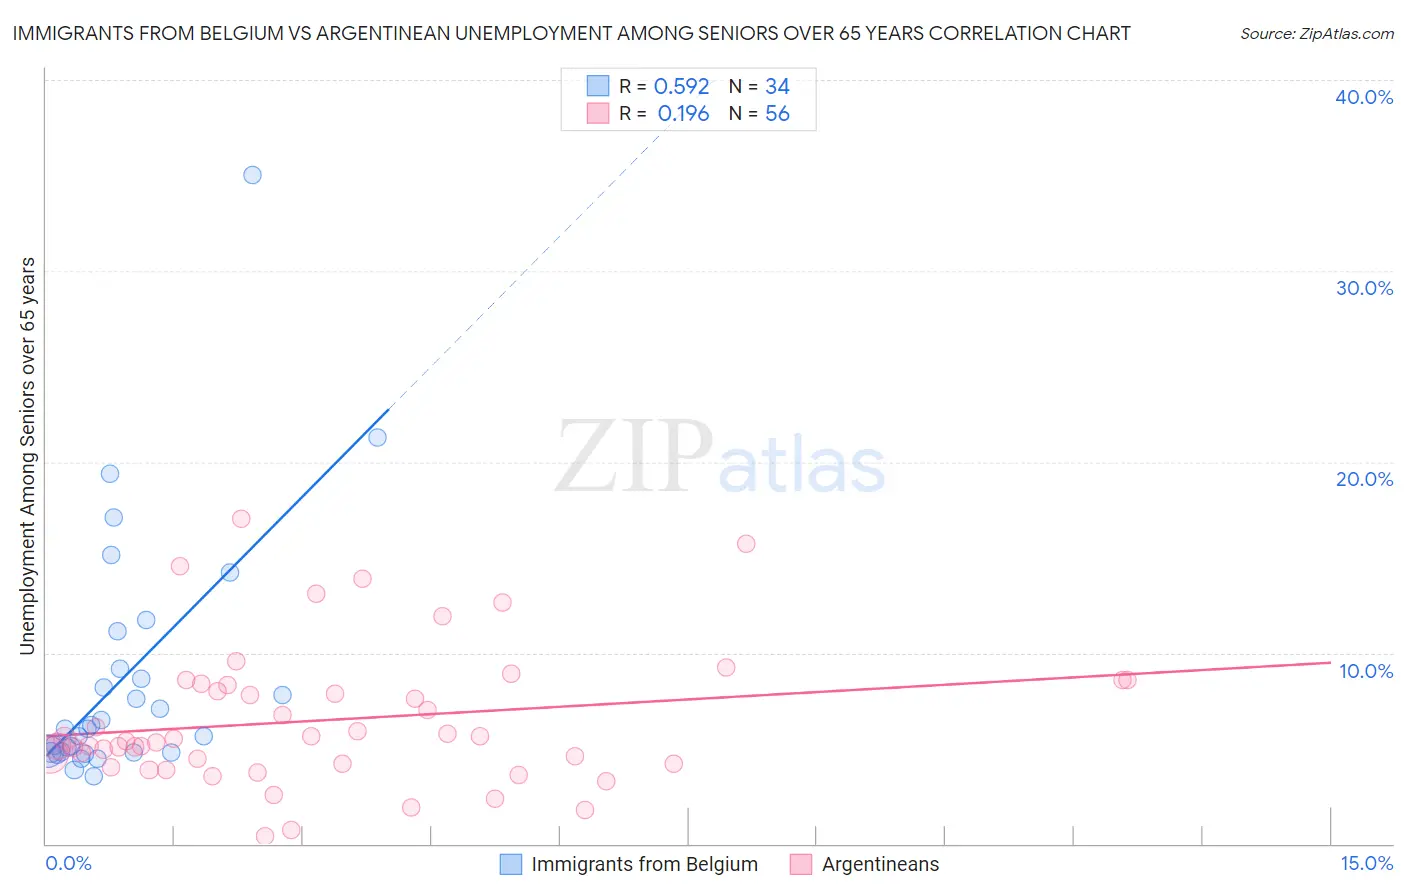
Immigrants from Belgium vs Argentinean Unemployment Among Seniors over 65 years Correlation Chart
The statistical analysis conducted on geographies consisting of 140,773,385 people shows a substantial positive correlation between the proportion of Immigrants from Belgium and unemployment rate amomg seniors over the age of 65 in the United States with a correlation coefficient (R) of 0.592 and weighted average of 5.2%. Similarly, the statistical analysis conducted on geographies consisting of 277,763,144 people shows a poor positive correlation between the proportion of Argentineans and unemployment rate amomg seniors over the age of 65 in the United States with a correlation coefficient (R) of 0.196 and weighted average of 5.2%, a difference of 0.54%.
Unemployment Among Seniors over 65 years Correlation Summary
| Measurement | Immigrants from Belgium | Argentinean |
| Minimum | 3.5% | 0.40% |
| Maximum | 35.0% | 17.0% |
| Range | 31.5% | 16.6% |
| Mean | 8.7% | 6.5% |
| Median | 6.0% | 5.4% |
| Interquartile 25% (IQ1) | 4.8% | 4.2% |
| Interquartile 75% (IQ3) | 9.2% | 8.4% |
| Interquartile Range (IQR) | 4.4% | 4.2% |
| Standard Deviation (Sample) | 6.5% | 3.6% |
| Standard Deviation (Population) | 6.4% | 3.6% |
Demographics Similar to Immigrants from Belgium and Argentineans by Unemployment Among Seniors over 65 years
In terms of unemployment among seniors over 65 years, the demographic groups most similar to Immigrants from Belgium are Immigrants from Somalia (5.2%, a difference of 0.020%), Icelander (5.2%, a difference of 0.040%), Russian (5.2%, a difference of 0.040%), Immigrants from Italy (5.2%, a difference of 0.040%), and Indian (Asian) (5.2%, a difference of 0.060%). Similarly, the demographic groups most similar to Argentineans are Immigrants from Africa (5.2%, a difference of 0.020%), Immigrants from Denmark (5.2%, a difference of 0.070%), Sioux (5.2%, a difference of 0.070%), Costa Rican (5.2%, a difference of 0.080%), and Korean (5.2%, a difference of 0.090%).
| Demographics | Rating | Rank | Unemployment Among Seniors over 65 years |
| Indians (Asian) | 46.6 /100 | #176 | Average 5.2% |
| Icelanders | 45.9 /100 | #177 | Average 5.2% |
| Immigrants | Belgium | 44.8 /100 | #178 | Average 5.2% |
| Immigrants | Somalia | 44.0 /100 | #179 | Average 5.2% |
| Russians | 43.6 /100 | #180 | Average 5.2% |
| Immigrants | Italy | 43.5 /100 | #181 | Average 5.2% |
| Panamanians | 43.0 /100 | #182 | Average 5.2% |
| Immigrants | Western Asia | 42.1 /100 | #183 | Average 5.2% |
| Immigrants | Serbia | 41.6 /100 | #184 | Average 5.2% |
| Immigrants | Iran | 36.0 /100 | #185 | Fair 5.2% |
| Americans | 35.1 /100 | #186 | Fair 5.2% |
| Somalis | 33.5 /100 | #187 | Fair 5.2% |
| Immigrants | Egypt | 33.2 /100 | #188 | Fair 5.2% |
| Bangladeshis | 32.3 /100 | #189 | Fair 5.2% |
| Koreans | 31.6 /100 | #190 | Fair 5.2% |
| Immigrants | Denmark | 31.0 /100 | #191 | Fair 5.2% |
| Sioux | 30.8 /100 | #192 | Fair 5.2% |
| Immigrants | Africa | 29.6 /100 | #193 | Fair 5.2% |
| Argentineans | 29.1 /100 | #194 | Fair 5.2% |
| Costa Ricans | 27.0 /100 | #195 | Fair 5.2% |
| Immigrants | Poland | 24.3 /100 | #196 | Fair 5.2% |