Immigrants from Belarus vs Hmong Unemployment Among Seniors over 75 years
COMPARE
Immigrants from Belarus
Hmong
Unemployment Among Seniors over 75 years
Unemployment Among Seniors over 75 years Comparison
Immigrants from Belarus
Hmong
8.0%
UNEMPLOYMENT AMONG SENIORS OVER 75 YEARS
99.8/ 100
METRIC RATING
78th/ 347
METRIC RANK
13.7%
UNEMPLOYMENT AMONG SENIORS OVER 75 YEARS
0.0/ 100
METRIC RATING
342nd/ 347
METRIC RANK
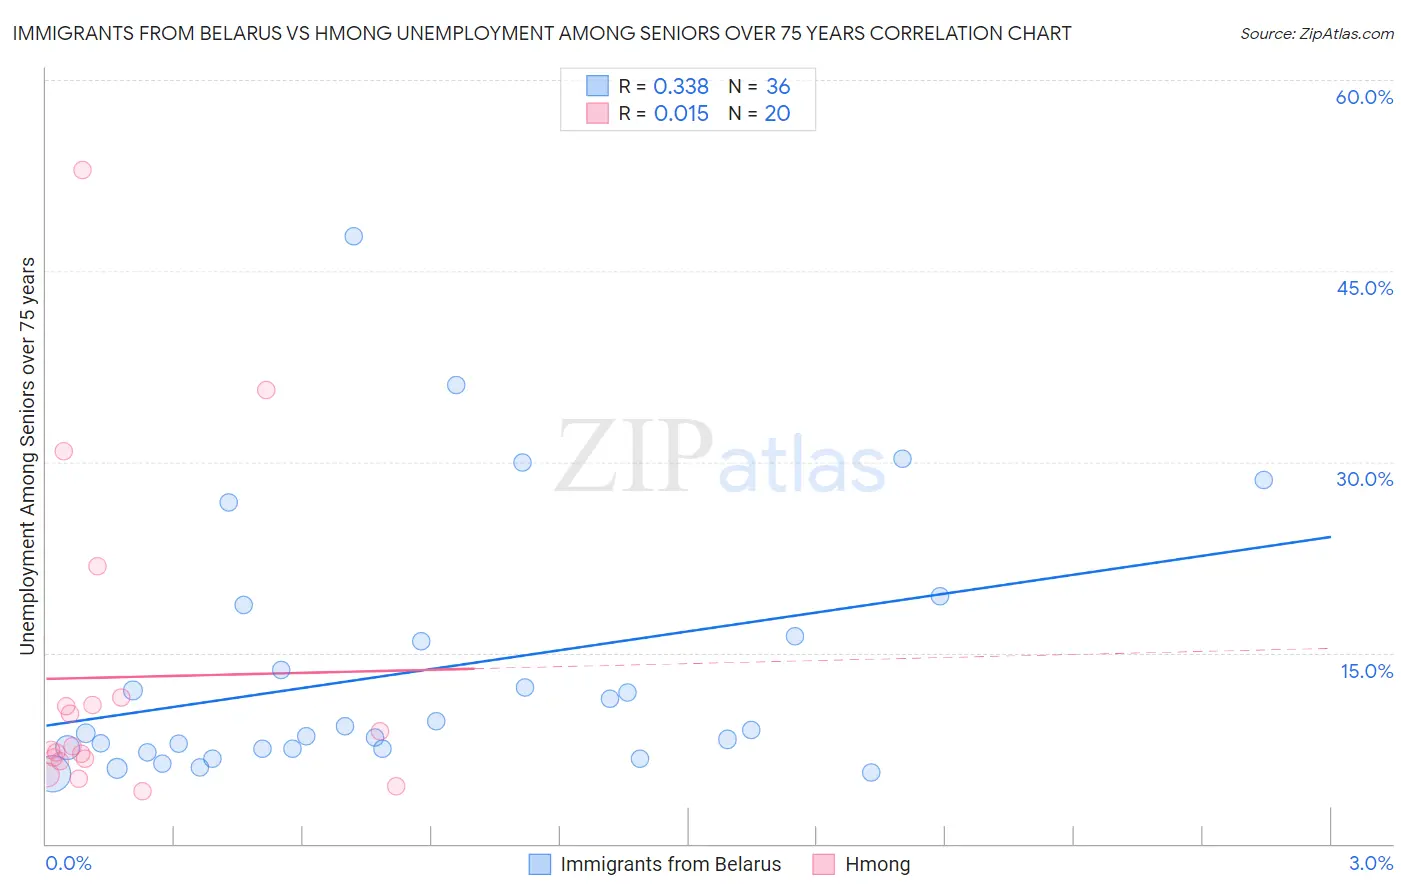
Immigrants from Belarus vs Hmong Unemployment Among Seniors over 75 years Correlation Chart
The statistical analysis conducted on geographies consisting of 106,145,567 people shows a mild positive correlation between the proportion of Immigrants from Belarus and unemployment rate among seniors over the age of 75 in the United States with a correlation coefficient (R) of 0.338 and weighted average of 8.0%. Similarly, the statistical analysis conducted on geographies consisting of 23,120,726 people shows no correlation between the proportion of Hmong and unemployment rate among seniors over the age of 75 in the United States with a correlation coefficient (R) of 0.015 and weighted average of 13.7%, a difference of 71.0%.
Unemployment Among Seniors over 75 years Correlation Summary
| Measurement | Immigrants from Belarus | Hmong |
| Minimum | 5.5% | 4.1% |
| Maximum | 47.7% | 52.9% |
| Range | 42.2% | 48.8% |
| Mean | 13.6% | 13.1% |
| Median | 8.8% | 7.5% |
| Interquartile 25% (IQ1) | 7.5% | 6.6% |
| Interquartile 75% (IQ3) | 16.1% | 11.2% |
| Interquartile Range (IQR) | 8.6% | 4.6% |
| Standard Deviation (Sample) | 10.0% | 12.7% |
| Standard Deviation (Population) | 9.9% | 12.4% |
Similar Demographics by Unemployment Among Seniors over 75 years
Demographics Similar to Immigrants from Belarus by Unemployment Among Seniors over 75 years
In terms of unemployment among seniors over 75 years, the demographic groups most similar to Immigrants from Belarus are Immigrants from Turkey (8.0%, a difference of 0.030%), Immigrants from Venezuela (8.0%, a difference of 0.080%), Immigrants from Uganda (8.0%, a difference of 0.19%), Immigrants from Japan (8.0%, a difference of 0.20%), and Immigrants from Australia (8.0%, a difference of 0.22%).
| Demographics | Rating | Rank | Unemployment Among Seniors over 75 years |
| Immigrants | Cambodia | 99.9 /100 | #71 | Exceptional 8.0% |
| Bolivians | 99.9 /100 | #72 | Exceptional 8.0% |
| Immigrants | France | 99.9 /100 | #73 | Exceptional 8.0% |
| Spanish Americans | 99.8 /100 | #74 | Exceptional 8.0% |
| Immigrants | Uganda | 99.8 /100 | #75 | Exceptional 8.0% |
| Immigrants | Venezuela | 99.8 /100 | #76 | Exceptional 8.0% |
| Immigrants | Turkey | 99.8 /100 | #77 | Exceptional 8.0% |
| Immigrants | Belarus | 99.8 /100 | #78 | Exceptional 8.0% |
| Immigrants | Japan | 99.7 /100 | #79 | Exceptional 8.0% |
| Immigrants | Australia | 99.7 /100 | #80 | Exceptional 8.0% |
| Cubans | 99.7 /100 | #81 | Exceptional 8.0% |
| Bhutanese | 99.7 /100 | #82 | Exceptional 8.0% |
| Arapaho | 99.7 /100 | #83 | Exceptional 8.1% |
| U.S. Virgin Islanders | 99.7 /100 | #84 | Exceptional 8.1% |
| Immigrants | Indonesia | 99.7 /100 | #85 | Exceptional 8.1% |
Demographics Similar to Hmong by Unemployment Among Seniors over 75 years
In terms of unemployment among seniors over 75 years, the demographic groups most similar to Hmong are Lumbee (13.5%, a difference of 2.0%), Alaska Native (14.7%, a difference of 6.8%), Yup'ik (12.8%, a difference of 7.6%), Cajun (12.5%, a difference of 10.0%), and Immigrants from Cabo Verde (12.3%, a difference of 11.4%).
| Demographics | Rating | Rank | Unemployment Among Seniors over 75 years |
| Alaskan Athabascans | 0.0 /100 | #333 | Tragic 11.0% |
| Assyrians/Chaldeans/Syriacs | 0.0 /100 | #334 | Tragic 11.1% |
| French Canadians | 0.0 /100 | #335 | Tragic 11.2% |
| Immigrants | North Macedonia | 0.0 /100 | #336 | Tragic 11.3% |
| Cape Verdeans | 0.0 /100 | #337 | Tragic 11.4% |
| Immigrants | Cabo Verde | 0.0 /100 | #338 | Tragic 12.3% |
| Cajuns | 0.0 /100 | #339 | Tragic 12.5% |
| Yup'ik | 0.0 /100 | #340 | Tragic 12.8% |
| Lumbee | 0.0 /100 | #341 | Tragic 13.5% |
| Hmong | 0.0 /100 | #342 | Tragic 13.7% |
| Alaska Natives | 0.0 /100 | #343 | Tragic 14.7% |
| Immigrants | Yemen | 0.0 /100 | #344 | Tragic 16.5% |
| Yakama | 0.0 /100 | #345 | Tragic 18.4% |
| Tlingit-Haida | 0.0 /100 | #346 | Tragic 20.7% |