Immigrants from Belarus vs Alaskan Athabascan Unemployment Among Seniors over 65 years
COMPARE
Immigrants from Belarus
Alaskan Athabascan
Unemployment Among Seniors over 65 years
Unemployment Among Seniors over 65 years Comparison
Immigrants from Belarus
Alaskan Athabascans
5.1%
UNEMPLOYMENT AMONG SENIORS OVER 65 YEARS
69.0/ 100
METRIC RATING
158th/ 347
METRIC RANK
7.0%
UNEMPLOYMENT AMONG SENIORS OVER 65 YEARS
0.0/ 100
METRIC RATING
344th/ 347
METRIC RANK
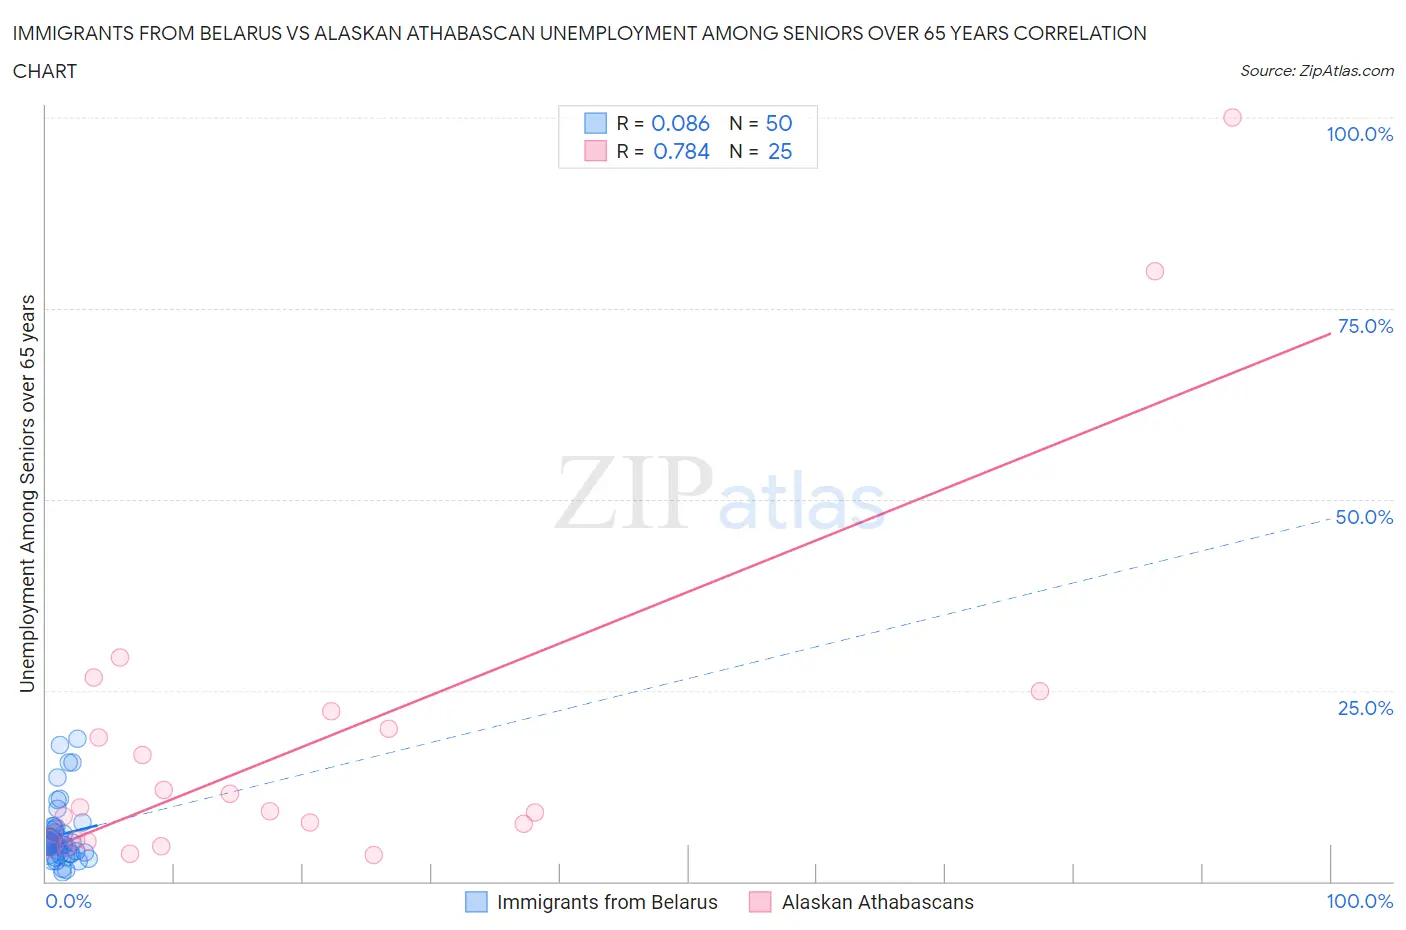
Immigrants from Belarus vs Alaskan Athabascan Unemployment Among Seniors over 65 years Correlation Chart
The statistical analysis conducted on geographies consisting of 144,578,638 people shows a slight positive correlation between the proportion of Immigrants from Belarus and unemployment rate amomg seniors over the age of 65 in the United States with a correlation coefficient (R) of 0.086 and weighted average of 5.1%. Similarly, the statistical analysis conducted on geographies consisting of 44,116,307 people shows a strong positive correlation between the proportion of Alaskan Athabascans and unemployment rate amomg seniors over the age of 65 in the United States with a correlation coefficient (R) of 0.784 and weighted average of 7.0%, a difference of 37.8%.
Unemployment Among Seniors over 65 years Correlation Summary
| Measurement | Immigrants from Belarus | Alaskan Athabascan |
| Minimum | 1.1% | 3.5% |
| Maximum | 18.6% | 100.0% |
| Range | 17.5% | 96.5% |
| Mean | 6.1% | 18.1% |
| Median | 5.0% | 9.2% |
| Interquartile 25% (IQ1) | 3.7% | 5.3% |
| Interquartile 75% (IQ3) | 6.9% | 21.1% |
| Interquartile Range (IQR) | 3.2% | 15.9% |
| Standard Deviation (Sample) | 4.0% | 23.1% |
| Standard Deviation (Population) | 4.0% | 22.7% |
Similar Demographics by Unemployment Among Seniors over 65 years
Demographics Similar to Immigrants from Belarus by Unemployment Among Seniors over 65 years
In terms of unemployment among seniors over 65 years, the demographic groups most similar to Immigrants from Belarus are Immigrants from France (5.1%, a difference of 0.020%), Immigrants from Northern Europe (5.1%, a difference of 0.030%), French (5.1%, a difference of 0.030%), Immigrants from Bosnia and Herzegovina (5.1%, a difference of 0.11%), and Immigrants from Romania (5.1%, a difference of 0.13%).
| Demographics | Rating | Rank | Unemployment Among Seniors over 65 years |
| Pakistanis | 75.5 /100 | #151 | Good 5.1% |
| Canadians | 74.7 /100 | #152 | Good 5.1% |
| Immigrants | Czechoslovakia | 74.5 /100 | #153 | Good 5.1% |
| Immigrants | Hong Kong | 74.0 /100 | #154 | Good 5.1% |
| Basques | 72.9 /100 | #155 | Good 5.1% |
| Immigrants | Romania | 72.4 /100 | #156 | Good 5.1% |
| Immigrants | Northern Europe | 69.8 /100 | #157 | Good 5.1% |
| Immigrants | Belarus | 69.0 /100 | #158 | Good 5.1% |
| Immigrants | France | 68.6 /100 | #159 | Good 5.1% |
| French | 68.1 /100 | #160 | Good 5.1% |
| Immigrants | Bosnia and Herzegovina | 66.1 /100 | #161 | Good 5.1% |
| Immigrants | South Eastern Asia | 65.6 /100 | #162 | Good 5.1% |
| Potawatomi | 64.5 /100 | #163 | Good 5.1% |
| Nepalese | 64.5 /100 | #164 | Good 5.1% |
| Immigrants | Ukraine | 64.2 /100 | #165 | Good 5.1% |
Demographics Similar to Alaskan Athabascans by Unemployment Among Seniors over 65 years
In terms of unemployment among seniors over 65 years, the demographic groups most similar to Alaskan Athabascans are Tlingit-Haida (6.8%, a difference of 3.8%), Navajo (6.7%, a difference of 5.1%), Yakama (6.7%, a difference of 5.6%), Ute (6.3%, a difference of 11.3%), and Paiute (6.3%, a difference of 11.3%).
| Demographics | Rating | Rank | Unemployment Among Seniors over 65 years |
| Immigrants | Dominican Republic | 0.0 /100 | #333 | Tragic 6.0% |
| Tohono O'odham | 0.0 /100 | #334 | Tragic 6.1% |
| Immigrants | Armenia | 0.0 /100 | #335 | Tragic 6.2% |
| Pima | 0.0 /100 | #336 | Tragic 6.3% |
| Alaska Natives | 0.0 /100 | #337 | Tragic 6.3% |
| Immigrants | Azores | 0.0 /100 | #338 | Tragic 6.3% |
| Paiute | 0.0 /100 | #339 | Tragic 6.3% |
| Ute | 0.0 /100 | #340 | Tragic 6.3% |
| Yakama | 0.0 /100 | #341 | Tragic 6.7% |
| Navajo | 0.0 /100 | #342 | Tragic 6.7% |
| Tlingit-Haida | 0.0 /100 | #343 | Tragic 6.8% |
| Alaskan Athabascans | 0.0 /100 | #344 | Tragic 7.0% |
| Immigrants | Yemen | 0.0 /100 | #345 | Tragic 8.2% |
| Yup'ik | 0.0 /100 | #346 | Tragic 9.1% |
| Crow | 0.0 /100 | #347 | Tragic 16.9% |