Immigrants from Barbados vs Immigrants from Armenia Unemployment Among Ages 30 to 34 years
COMPARE
Immigrants from Barbados
Immigrants from Armenia
Unemployment Among Ages 30 to 34 years
Unemployment Among Ages 30 to 34 years Comparison
Immigrants from Barbados
Immigrants from Armenia
6.6%
UNEMPLOYMENT AMONG AGES 30 TO 34 YEARS
0.0/ 100
METRIC RATING
298th/ 347
METRIC RANK
6.8%
UNEMPLOYMENT AMONG AGES 30 TO 34 YEARS
0.0/ 100
METRIC RATING
306th/ 347
METRIC RANK
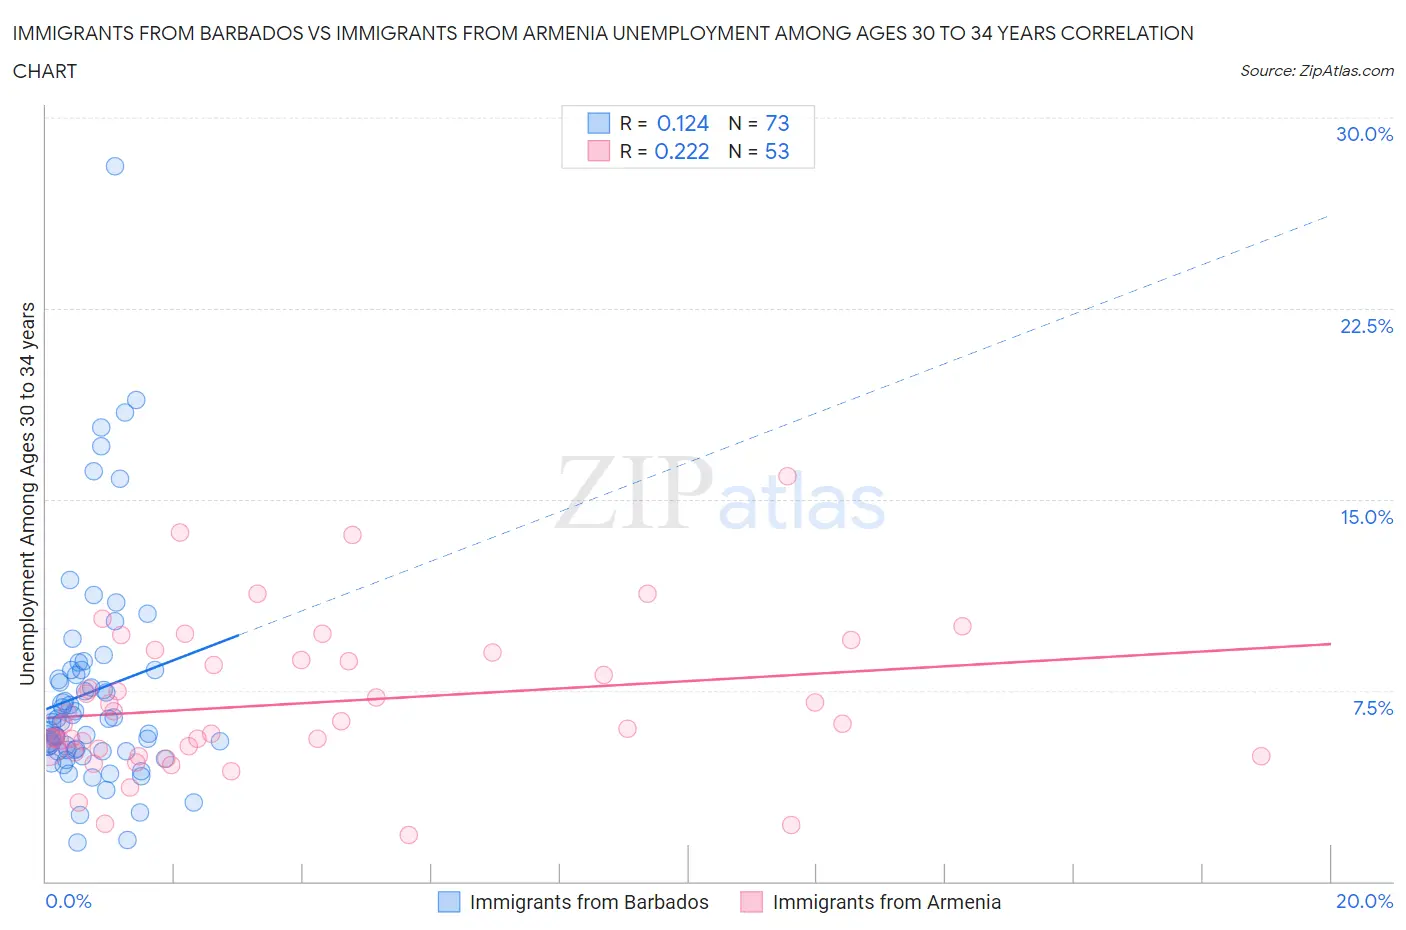
Immigrants from Barbados vs Immigrants from Armenia Unemployment Among Ages 30 to 34 years Correlation Chart
The statistical analysis conducted on geographies consisting of 111,082,370 people shows a poor positive correlation between the proportion of Immigrants from Barbados and unemployment rate among population between the ages 30 and 34 in the United States with a correlation coefficient (R) of 0.124 and weighted average of 6.6%. Similarly, the statistical analysis conducted on geographies consisting of 96,543,189 people shows a weak positive correlation between the proportion of Immigrants from Armenia and unemployment rate among population between the ages 30 and 34 in the United States with a correlation coefficient (R) of 0.222 and weighted average of 6.8%, a difference of 4.2%.
Unemployment Among Ages 30 to 34 years Correlation Summary
| Measurement | Immigrants from Barbados | Immigrants from Armenia |
| Minimum | 1.5% | 1.8% |
| Maximum | 28.1% | 15.9% |
| Range | 26.6% | 14.1% |
| Mean | 7.4% | 7.0% |
| Median | 6.2% | 6.2% |
| Interquartile 25% (IQ1) | 5.1% | 5.1% |
| Interquartile 75% (IQ3) | 8.3% | 8.8% |
| Interquartile Range (IQR) | 3.2% | 3.7% |
| Standard Deviation (Sample) | 4.4% | 2.9% |
| Standard Deviation (Population) | 4.4% | 2.9% |
Demographics Similar to Immigrants from Barbados and Immigrants from Armenia by Unemployment Among Ages 30 to 34 years
In terms of unemployment among ages 30 to 34 years, the demographic groups most similar to Immigrants from Barbados are Dutch West Indian (6.6%, a difference of 0.10%), Bahamian (6.6%, a difference of 0.15%), Creek (6.6%, a difference of 0.25%), Immigrants from Jamaica (6.5%, a difference of 0.35%), and Trinidadian and Tobagonian (6.5%, a difference of 0.40%). Similarly, the demographic groups most similar to Immigrants from Armenia are Immigrants from Belize (6.9%, a difference of 0.19%), Immigrants from the Azores (6.9%, a difference of 0.57%), Immigrants from Grenada (6.9%, a difference of 1.3%), Immigrants from St. Vincent and the Grenadines (7.0%, a difference of 1.6%), and Paiute (6.7%, a difference of 2.2%).
| Demographics | Rating | Rank | Unemployment Among Ages 30 to 34 years |
| Vietnamese | 0.0 /100 | #292 | Tragic 6.5% |
| West Indians | 0.0 /100 | #293 | Tragic 6.5% |
| Barbadians | 0.0 /100 | #294 | Tragic 6.5% |
| Trinidadians and Tobagonians | 0.0 /100 | #295 | Tragic 6.5% |
| Immigrants | Jamaica | 0.0 /100 | #296 | Tragic 6.5% |
| Creek | 0.0 /100 | #297 | Tragic 6.6% |
| Immigrants | Barbados | 0.0 /100 | #298 | Tragic 6.6% |
| Dutch West Indians | 0.0 /100 | #299 | Tragic 6.6% |
| Bahamians | 0.0 /100 | #300 | Tragic 6.6% |
| Belizeans | 0.0 /100 | #301 | Tragic 6.6% |
| Delaware | 0.0 /100 | #302 | Tragic 6.7% |
| Cajuns | 0.0 /100 | #303 | Tragic 6.7% |
| Kiowa | 0.0 /100 | #304 | Tragic 6.7% |
| Paiute | 0.0 /100 | #305 | Tragic 6.7% |
| Immigrants | Armenia | 0.0 /100 | #306 | Tragic 6.8% |
| Immigrants | Belize | 0.0 /100 | #307 | Tragic 6.9% |
| Immigrants | Azores | 0.0 /100 | #308 | Tragic 6.9% |
| Immigrants | Grenada | 0.0 /100 | #309 | Tragic 6.9% |
| Immigrants | St. Vincent and the Grenadines | 0.0 /100 | #310 | Tragic 7.0% |
| Alaskan Athabascans | 0.0 /100 | #311 | Tragic 7.0% |
| British West Indians | 0.0 /100 | #312 | Tragic 7.0% |