Immigrants from Bangladesh vs Immigrants from Nepal Unemployment Among Seniors over 65 years

COMPARE

Immigrants from Bangladesh
Race
Ancestry
AfghanAfricanAlaska NativeAlaskan AthabascanAlbanianAleutAlsatianAmericanApacheArabArapahoArgentineanArmenianAssyrian/Chaldean/SyriacAustralianAustrianBahamianBangladeshiBarbadianBasqueBelgianBelizeanBermudanBhutaneseBlackfeetBolivianBrazilianBritishBritish West IndianBulgarianBurmeseCajunCambodianCanadianCape VerdeanCarpatho RusynCelticCentral AmericanCentral American IndianCherokeeCheyenneChickasawChileanChineseChippewaChoctawColombianColvilleComancheCosta RicanCreeCreekCroatianCrowCubanCypriotCzechCzechoslovakianDanishDelawareDominicanDutchDutch West IndianEastern EuropeanEcuadorianEgyptianEnglishEstonianEthiopianEuropeanFijianFilipinoFinnishFrenchFrench American IndianFrench CanadianGermanGerman RussianGhanaianGreekGuamanian/ChamorroGuatemalanGuyaneseHaitianHmongHonduranHopiHoumaHungarianIcelanderIndian (Asian)IndonesianInupiatIranianIraqiIrishIroquoisIsraeliItalianJamaicanJapaneseJordanianKenyanKiowaKoreanLaotianLatvianLebaneseLiberianLithuanianLumbeeLuxembourgerMacedonianMalaysianMalteseMarshalleseMenomineeMexicanMexican American IndianMongolianMoroccanNative HawaiianNavajoNepaleseNew ZealanderNicaraguanNigerianNorthern EuropeanNorwegianOkinawanOsageOttawaPaiutePakistaniPalestinianPanamanianParaguayanPennsylvania GermanPeruvianPimaPolishPortuguesePotawatomiPuebloPuerto RicanPuget Sound SalishRomanianRussianSalvadoranSamoanScandinavianScotch-IrishScottishSeminoleSenegaleseSerbianShoshoneSierra LeoneanSiouxSlavicSlovakSloveneSomaliSouth AfricanSouth AmericanSouth American IndianSoviet UnionSpaniardSpanishSpanish AmericanSpanish American IndianSri LankanSubsaharan AfricanSudaneseSwedishSwissSyrianTaiwaneseThaiTlingit-HaidaTohono O'OdhamTonganTrinidadian and TobagonianTsimshianTurkishU.S. Virgin IslanderUgandanUkrainianUruguayanUteVenezuelanVietnameseWelshWest IndianYakamaYaquiYugoslavianYumanYup'ikZimbabwean
Immigration
NonimmigrantsImmigrantsAfghanistanAfricaAlbaniaArgentinaArmeniaAsiaAustraliaAustriaBahamasBangladeshBarbadosBelarusBelgiumBelizeBoliviaBosnia and HerzegovinaBrazilBulgariaBurma/MyanmarCabo VerdeCambodiaCameroonCanadaCaribbeanCentral AmericaChileChinaColombiaCongoCosta RicaCroatiaCubaCzechoslovakiaDenmarkDominicaDominican RepublicEastern AfricaEastern AsiaEastern EuropeEcuadorEgyptEl SalvadorEnglandEritreaEthiopiaEuropeFijiFranceGermanyGhanaGreeceGrenadaGuatemalaGuyanaHaitiHondurasHong KongHungaryIndiaIndonesiaIranIraqIrelandIsraelItalyJamaicaJapanJordanKazakhstanKenyaKoreaKuwaitLaosLatin AmericaLatviaLebanonLiberiaLithuaniaMalaysiaMexicoMicronesiaMiddle AfricaMoldovaMoroccoNetherlandsNicaraguaNigeriaNorth AmericaNorth MacedoniaNorthern AfricaNorthern EuropeNorwayOceaniaPakistanPanamaPeruPhilippinesPolandPortugalRomaniaRussiaSaudi ArabiaScotlandSenegalSerbiaSierra LeoneSingaporeSomaliaSouth AfricaSouth AmericaSouth Central AsiaSouth Eastern AsiaSouthern EuropeSpainSri LankaSt. Vincent and the GrenadinesSudanSwedenSwitzerlandSyriaTaiwanThailandTrinidad and TobagoTurkeyUgandaUkraineUruguayUzbekistanVenezuelaVietnamWest IndiesWestern AfricaWestern AsiaWestern EuropeYemenZaireZimbabweAzores
Immigrants from Nepal
Race
Ancestry
AfghanAfricanAlaska NativeAlaskan AthabascanAlbanianAleutAlsatianAmericanApacheArabArapahoArgentineanArmenianAssyrian/Chaldean/SyriacAustralianAustrianBahamianBangladeshiBarbadianBasqueBelgianBelizeanBermudanBhutaneseBlackfeetBolivianBrazilianBritishBritish West IndianBulgarianBurmeseCajunCambodianCanadianCape VerdeanCarpatho RusynCelticCentral AmericanCentral American IndianCherokeeCheyenneChickasawChileanChineseChippewaChoctawColombianColvilleComancheCosta RicanCreeCreekCroatianCrowCubanCypriotCzechCzechoslovakianDanishDelawareDominicanDutchDutch West IndianEastern EuropeanEcuadorianEgyptianEnglishEstonianEthiopianEuropeanFijianFilipinoFinnishFrenchFrench American IndianFrench CanadianGermanGerman RussianGhanaianGreekGuamanian/ChamorroGuatemalanGuyaneseHaitianHmongHonduranHopiHoumaHungarianIcelanderIndian (Asian)IndonesianInupiatIranianIraqiIrishIroquoisIsraeliItalianJamaicanJapaneseJordanianKenyanKiowaKoreanLaotianLatvianLebaneseLiberianLithuanianLumbeeLuxembourgerMacedonianMalaysianMalteseMarshalleseMenomineeMexicanMexican American IndianMongolianMoroccanNative HawaiianNavajoNepaleseNew ZealanderNicaraguanNigerianNorthern EuropeanNorwegianOkinawanOsageOttawaPaiutePakistaniPalestinianPanamanianParaguayanPennsylvania GermanPeruvianPimaPolishPortuguesePotawatomiPuebloPuerto RicanPuget Sound SalishRomanianRussianSalvadoranSamoanScandinavianScotch-IrishScottishSeminoleSenegaleseSerbianShoshoneSierra LeoneanSiouxSlavicSlovakSloveneSomaliSouth AfricanSouth AmericanSouth American IndianSoviet UnionSpaniardSpanishSpanish AmericanSpanish American IndianSri LankanSubsaharan AfricanSudaneseSwedishSwissSyrianTaiwaneseThaiTlingit-HaidaTohono O'OdhamTonganTrinidadian and TobagonianTsimshianTurkishU.S. Virgin IslanderUgandanUkrainianUruguayanUteVenezuelanVietnameseWelshWest IndianYakamaYaquiYugoslavianYumanYup'ikZimbabwean
Immigration
NonimmigrantsImmigrantsAfghanistanAfricaAlbaniaArgentinaArmeniaAsiaAustraliaAustriaBahamasBarbadosBelarusBelgiumBelizeBoliviaBosnia and HerzegovinaBrazilBulgariaBurma/MyanmarCabo VerdeCambodiaCameroonCanadaCaribbeanCentral AmericaChileChinaColombiaCongoCosta RicaCroatiaCubaCzechoslovakiaDenmarkDominicaDominican RepublicEastern AfricaEastern AsiaEastern EuropeEcuadorEgyptEl SalvadorEnglandEritreaEthiopiaEuropeFijiFranceGermanyGhanaGreeceGrenadaGuatemalaGuyanaHaitiHondurasHong KongHungaryIndiaIndonesiaIranIraqIrelandIsraelItalyJamaicaJapanJordanKazakhstanKenyaKoreaKuwaitLaosLatin AmericaLatviaLebanonLiberiaLithuaniaMalaysiaMexicoMicronesiaMiddle AfricaMoldovaMoroccoNepalNetherlandsNicaraguaNigeriaNorth AmericaNorth MacedoniaNorthern AfricaNorthern EuropeNorwayOceaniaPakistanPanamaPeruPhilippinesPolandPortugalRomaniaRussiaSaudi ArabiaScotlandSenegalSerbiaSierra LeoneSingaporeSomaliaSouth AfricaSouth AmericaSouth Central AsiaSouth Eastern AsiaSouthern EuropeSpainSri LankaSt. Vincent and the GrenadinesSudanSwedenSwitzerlandSyriaTaiwanThailandTrinidad and TobagoTurkeyUgandaUkraineUruguayUzbekistanVenezuelaVietnamWest IndiesWestern AfricaWestern AsiaWestern EuropeYemenZaireZimbabweAzores
Unemployment Among Seniors over 65 years
Income
Poverty
Unemployment
Labor Participation
Family Structure
Vehicle Availability
Education Level
Disability

Unemployment Among Seniors over 65 years Comparison

Immigrants from Bangladesh

Immigrants from Nepal

Tragic
Exceptional
5.7%
UNEMPLOYMENT AMONG SENIORS OVER 65 YEARS
0.0/ 100
METRIC RATING
319th/ 347
METRIC RANK
4.7%
UNEMPLOYMENT AMONG SENIORS OVER 65 YEARS
100.0/ 100
METRIC RATING
20th/ 347
METRIC RANK

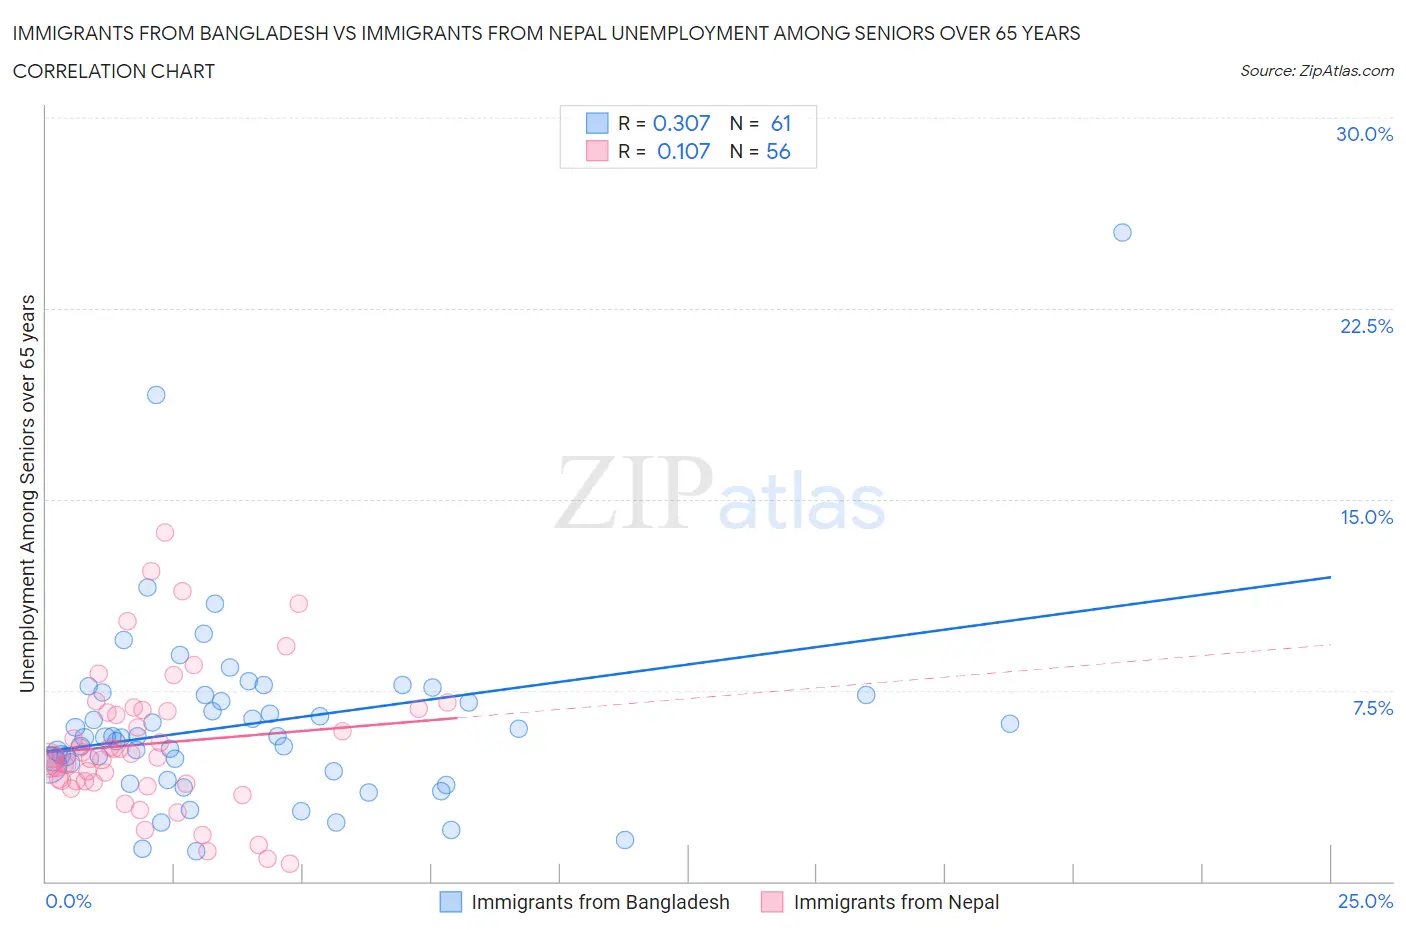
Immigrants from Bangladesh vs Immigrants from Nepal Unemployment Among Seniors over 65 years Correlation Chart

The statistical analysis conducted on geographies consisting of 194,728,762 people shows a mild positive correlation between the proportion of Immigrants from Bangladesh and unemployment rate amomg seniors over the age of 65 in the United States with a correlation coefficient (R) of 0.307 and weighted average of 5.7%. Similarly, the statistical analysis conducted on geographies consisting of 175,931,745 people shows a poor positive correlation between the proportion of Immigrants from Nepal and unemployment rate amomg seniors over the age of 65 in the United States with a correlation coefficient (R) of 0.107 and weighted average of 4.7%, a difference of 22.2%.
Immigrants from Bangladesh vs Immigrants from Nepal Unemployment Among Seniors over 65 years

Unemployment Among Seniors over 65 years Correlation Summary

MeasurementImmigrants from BangladeshImmigrants from Nepal
Minimum1.2%0.70%
Maximum25.5%13.7%
Range24.3%13.0%
Mean6.2%5.4%
Median5.7%4.9%
Interquartile 25% (IQ1)4.4%3.9%
Interquartile 75% (IQ3)7.3%6.7%
Interquartile Range (IQR)2.9%2.8%
Standard Deviation (Sample)3.8%2.7%
Standard Deviation (Population)3.7%2.7%

Similar Demographics by Unemployment Among Seniors over 65 years

Demographics Similar to Immigrants from Bangladesh by Unemployment Among Seniors over 65 years

In terms of unemployment among seniors over 65 years, the demographic groups most similar to Immigrants from Bangladesh are Immigrants from Mexico (5.7%, a difference of 0.16%), Vietnamese (5.7%, a difference of 0.22%), Immigrants from Bahamas (5.7%, a difference of 0.54%), Immigrants from Central America (5.7%, a difference of 0.66%), and British West Indian (5.8%, a difference of 0.80%).
DemographicsRating | RankUnemployment Among Seniors over 65 years
Immigrants | Ecuador
0.0
/100
|
#312
Tragic
5.6%
Barbadians
0.0
/100
|
#313
Tragic
5.6%
Delaware
0.0
/100
|
#314
Tragic
5.7%
Immigrants | El Salvador
0.0
/100
|
#315
Tragic
5.7%
Immigrants | Central America
0.0
/100
|
#316
Tragic
5.7%
Immigrants | Bahamas
0.0
/100
|
#317
Tragic
5.7%
Vietnamese
0.0
/100
|
#318
Tragic
5.7%
Immigrants | Bangladesh
0.0
/100
|
#319
Tragic
5.7%
Immigrants | Mexico
0.0
/100
|
#320
Tragic
5.7%
British West Indians
0.0
/100
|
#321
Tragic
5.8%
Natives/Alaskans
0.0
/100
|
#322
Tragic
5.8%
Immigrants | Dominica
0.0
/100
|
#323
Tragic
5.8%
Yuman
0.0
/100
|
#324
Tragic
5.8%
Inupiat
0.0
/100
|
#325
Tragic
5.8%
Shoshone
0.0
/100
|
#326
Tragic
5.9%

Demographics Similar to Immigrants from Nepal by Unemployment Among Seniors over 65 years

In terms of unemployment among seniors over 65 years, the demographic groups most similar to Immigrants from Nepal are Lebanese (4.7%, a difference of 0.0%), Norwegian (4.7%, a difference of 0.22%), Czech (4.7%, a difference of 0.40%), Immigrants from Eritrea (4.7%, a difference of 0.59%), and Kenyan (4.7%, a difference of 0.82%).
DemographicsRating | RankUnemployment Among Seniors over 65 years
Cubans
100.0
/100
|
#13
Exceptional
4.6%
Menominee
100.0
/100
|
#14
Exceptional
4.6%
Lumbee
100.0
/100
|
#15
Exceptional
4.6%
Immigrants | Burma/Myanmar
100.0
/100
|
#16
Exceptional
4.6%
Creek
100.0
/100
|
#17
Exceptional
4.6%
Immigrants | Eritrea
100.0
/100
|
#18
Exceptional
4.7%
Lebanese
100.0
/100
|
#19
Exceptional
4.7%
Immigrants | Nepal
100.0
/100
|
#20
Exceptional
4.7%
Norwegians
100.0
/100
|
#21
Exceptional
4.7%
Czechs
100.0
/100
|
#22
Exceptional
4.7%
Kenyans
100.0
/100
|
#23
Exceptional
4.7%
Iraqis
100.0
/100
|
#24
Exceptional
4.7%
Tongans
100.0
/100
|
#25
Exceptional
4.7%
Immigrants | Lebanon
100.0
/100
|
#26
Exceptional
4.8%
Houma
100.0
/100
|
#27
Exceptional
4.8%