Immigrants from Bahamas vs Immigrants from St. Vincent and the Grenadines Unemployment Among Ages 60 to 64 years
COMPARE
Immigrants from Bahamas
Immigrants from St. Vincent and the Grenadines
Unemployment Among Ages 60 to 64 years
Unemployment Among Ages 60 to 64 years Comparison
Immigrants from Bahamas
Immigrants from St. Vincent and the Grenadines
5.1%
UNEMPLOYMENT AMONG AGES 60 TO 64 YEARS
0.2/ 100
METRIC RATING
267th/ 347
METRIC RANK
5.9%
UNEMPLOYMENT AMONG AGES 60 TO 64 YEARS
0.0/ 100
METRIC RATING
326th/ 347
METRIC RANK
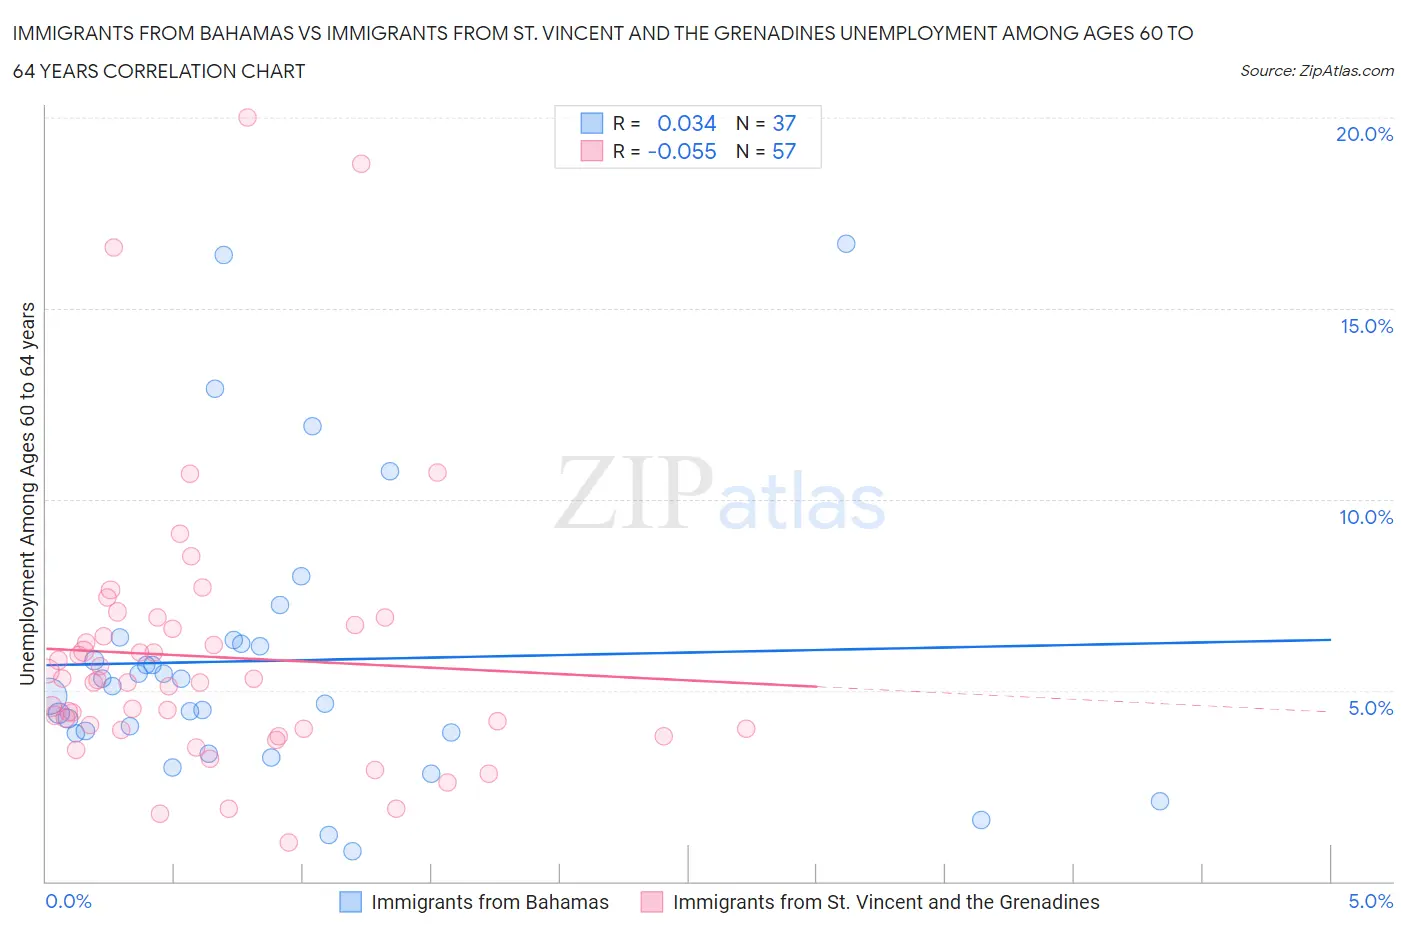
Immigrants from Bahamas vs Immigrants from St. Vincent and the Grenadines Unemployment Among Ages 60 to 64 years Correlation Chart
The statistical analysis conducted on geographies consisting of 100,648,095 people shows no correlation between the proportion of Immigrants from Bahamas and unemployment rate among population between the ages 60 and 64 in the United States with a correlation coefficient (R) of 0.034 and weighted average of 5.1%. Similarly, the statistical analysis conducted on geographies consisting of 54,910,392 people shows a slight negative correlation between the proportion of Immigrants from St. Vincent and the Grenadines and unemployment rate among population between the ages 60 and 64 in the United States with a correlation coefficient (R) of -0.055 and weighted average of 5.9%, a difference of 14.5%.
Unemployment Among Ages 60 to 64 years Correlation Summary
| Measurement | Immigrants from Bahamas | Immigrants from St. Vincent and the Grenadines |
| Minimum | 0.80% | 1.0% |
| Maximum | 16.7% | 20.0% |
| Range | 15.9% | 19.0% |
| Mean | 5.8% | 5.9% |
| Median | 5.1% | 5.2% |
| Interquartile 25% (IQ1) | 3.9% | 4.0% |
| Interquartile 75% (IQ3) | 6.3% | 6.7% |
| Interquartile Range (IQR) | 2.4% | 2.7% |
| Standard Deviation (Sample) | 3.7% | 3.6% |
| Standard Deviation (Population) | 3.6% | 3.6% |
Similar Demographics by Unemployment Among Ages 60 to 64 years
Demographics Similar to Immigrants from Bahamas by Unemployment Among Ages 60 to 64 years
In terms of unemployment among ages 60 to 64 years, the demographic groups most similar to Immigrants from Bahamas are Immigrants from Australia (5.1%, a difference of 0.050%), Immigrants from Argentina (5.1%, a difference of 0.070%), Central American Indian (5.1%, a difference of 0.16%), Immigrants from Costa Rica (5.1%, a difference of 0.20%), and Sioux (5.1%, a difference of 0.41%).
| Demographics | Rating | Rank | Unemployment Among Ages 60 to 64 years |
| Immigrants | Honduras | 0.4 /100 | #260 | Tragic 5.1% |
| Immigrants | Ghana | 0.4 /100 | #261 | Tragic 5.1% |
| Immigrants | Uzbekistan | 0.4 /100 | #262 | Tragic 5.1% |
| Immigrants | Immigrants | 0.4 /100 | #263 | Tragic 5.1% |
| Sioux | 0.3 /100 | #264 | Tragic 5.1% |
| Immigrants | Argentina | 0.2 /100 | #265 | Tragic 5.1% |
| Immigrants | Australia | 0.2 /100 | #266 | Tragic 5.1% |
| Immigrants | Bahamas | 0.2 /100 | #267 | Tragic 5.1% |
| Central American Indians | 0.2 /100 | #268 | Tragic 5.1% |
| Immigrants | Costa Rica | 0.2 /100 | #269 | Tragic 5.1% |
| Immigrants | Iran | 0.1 /100 | #270 | Tragic 5.1% |
| Israelis | 0.1 /100 | #271 | Tragic 5.2% |
| Haitians | 0.1 /100 | #272 | Tragic 5.2% |
| Immigrants | Spain | 0.1 /100 | #273 | Tragic 5.2% |
| Hopi | 0.1 /100 | #274 | Tragic 5.2% |
Demographics Similar to Immigrants from St. Vincent and the Grenadines by Unemployment Among Ages 60 to 64 years
In terms of unemployment among ages 60 to 64 years, the demographic groups most similar to Immigrants from St. Vincent and the Grenadines are Immigrants from Grenada (5.9%, a difference of 0.060%), Paiute (5.8%, a difference of 0.94%), Immigrants from Ecuador (5.8%, a difference of 0.95%), Alsatian (5.8%, a difference of 1.3%), and Apache (6.0%, a difference of 1.4%).
| Demographics | Rating | Rank | Unemployment Among Ages 60 to 64 years |
| Immigrants | Belize | 0.0 /100 | #319 | Tragic 5.7% |
| Colville | 0.0 /100 | #320 | Tragic 5.7% |
| Dutch West Indians | 0.0 /100 | #321 | Tragic 5.7% |
| Ecuadorians | 0.0 /100 | #322 | Tragic 5.8% |
| Alsatians | 0.0 /100 | #323 | Tragic 5.8% |
| Immigrants | Ecuador | 0.0 /100 | #324 | Tragic 5.8% |
| Paiute | 0.0 /100 | #325 | Tragic 5.8% |
| Immigrants | St. Vincent and the Grenadines | 0.0 /100 | #326 | Tragic 5.9% |
| Immigrants | Grenada | 0.0 /100 | #327 | Tragic 5.9% |
| Apache | 0.0 /100 | #328 | Tragic 6.0% |
| Immigrants | Bangladesh | 0.0 /100 | #329 | Tragic 6.0% |
| Immigrants | Armenia | 0.0 /100 | #330 | Tragic 6.0% |
| Yakama | 0.0 /100 | #331 | Tragic 6.0% |
| Dominicans | 0.0 /100 | #332 | Tragic 6.0% |
| Immigrants | Dominican Republic | 0.0 /100 | #333 | Tragic 6.0% |