Immigrants from Bahamas vs Cajun Unemployment Among Ages 55 to 59 years
COMPARE
Immigrants from Bahamas
Cajun
Unemployment Among Ages 55 to 59 years
Unemployment Among Ages 55 to 59 years Comparison
Immigrants from Bahamas
Cajuns
4.8%
UNEMPLOYMENT AMONG AGES 55 TO 59 YEARS
71.8/ 100
METRIC RATING
148th/ 347
METRIC RANK
5.3%
UNEMPLOYMENT AMONG AGES 55 TO 59 YEARS
0.0/ 100
METRIC RATING
294th/ 347
METRIC RANK
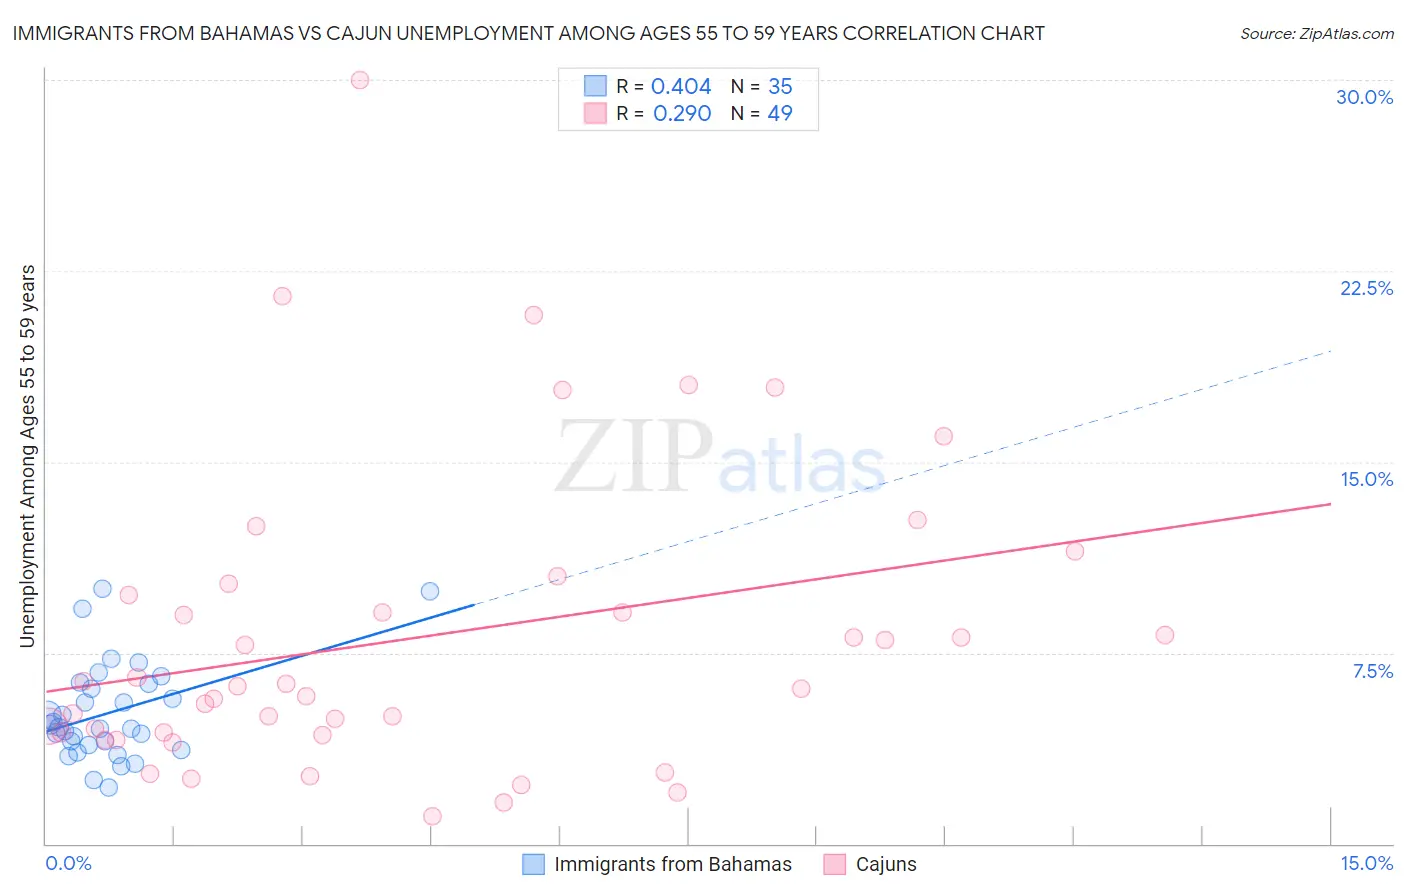
Immigrants from Bahamas vs Cajun Unemployment Among Ages 55 to 59 years Correlation Chart
The statistical analysis conducted on geographies consisting of 102,294,288 people shows a moderate positive correlation between the proportion of Immigrants from Bahamas and unemployment rate among population between the ages 55 and 59 in the United States with a correlation coefficient (R) of 0.404 and weighted average of 4.8%. Similarly, the statistical analysis conducted on geographies consisting of 141,735,204 people shows a weak positive correlation between the proportion of Cajuns and unemployment rate among population between the ages 55 and 59 in the United States with a correlation coefficient (R) of 0.290 and weighted average of 5.3%, a difference of 11.6%.
Unemployment Among Ages 55 to 59 years Correlation Summary
| Measurement | Immigrants from Bahamas | Cajun |
| Minimum | 2.2% | 1.1% |
| Maximum | 10.0% | 30.0% |
| Range | 7.8% | 28.9% |
| Mean | 5.1% | 8.1% |
| Median | 4.6% | 6.2% |
| Interquartile 25% (IQ1) | 3.9% | 4.3% |
| Interquartile 75% (IQ3) | 6.3% | 10.0% |
| Interquartile Range (IQR) | 2.4% | 5.7% |
| Standard Deviation (Sample) | 1.9% | 6.0% |
| Standard Deviation (Population) | 1.9% | 5.9% |
Similar Demographics by Unemployment Among Ages 55 to 59 years
Demographics Similar to Immigrants from Bahamas by Unemployment Among Ages 55 to 59 years
In terms of unemployment among ages 55 to 59 years, the demographic groups most similar to Immigrants from Bahamas are Immigrants from Lithuania (4.8%, a difference of 0.050%), Immigrants from Northern Africa (4.8%, a difference of 0.10%), Bahamian (4.8%, a difference of 0.16%), Laotian (4.8%, a difference of 0.17%), and Immigrants from Uruguay (4.8%, a difference of 0.22%).
| Demographics | Rating | Rank | Unemployment Among Ages 55 to 59 years |
| French Canadians | 80.1 /100 | #141 | Excellent 4.8% |
| Immigrants | Norway | 79.8 /100 | #142 | Good 4.8% |
| Ukrainians | 78.6 /100 | #143 | Good 4.8% |
| Immigrants | Asia | 77.8 /100 | #144 | Good 4.8% |
| Immigrants | Northern Europe | 77.5 /100 | #145 | Good 4.8% |
| Immigrants | South Eastern Asia | 77.4 /100 | #146 | Good 4.8% |
| Immigrants | Singapore | 76.6 /100 | #147 | Good 4.8% |
| Immigrants | Bahamas | 71.8 /100 | #148 | Good 4.8% |
| Immigrants | Lithuania | 70.8 /100 | #149 | Good 4.8% |
| Immigrants | Northern Africa | 69.8 /100 | #150 | Good 4.8% |
| Bahamians | 68.6 /100 | #151 | Good 4.8% |
| Laotians | 68.2 /100 | #152 | Good 4.8% |
| Immigrants | Uruguay | 67.2 /100 | #153 | Good 4.8% |
| Immigrants | Panama | 66.8 /100 | #154 | Good 4.8% |
| Immigrants | North Macedonia | 66.3 /100 | #155 | Good 4.8% |
Demographics Similar to Cajuns by Unemployment Among Ages 55 to 59 years
In terms of unemployment among ages 55 to 59 years, the demographic groups most similar to Cajuns are Immigrants from Grenada (5.3%, a difference of 0.12%), Dutch West Indian (5.3%, a difference of 0.12%), Barbadian (5.3%, a difference of 0.16%), British West Indian (5.3%, a difference of 0.31%), and Immigrants from Mexico (5.3%, a difference of 0.38%).
| Demographics | Rating | Rank | Unemployment Among Ages 55 to 59 years |
| Immigrants | Guatemala | 0.0 /100 | #287 | Tragic 5.3% |
| Immigrants | Israel | 0.0 /100 | #288 | Tragic 5.3% |
| Immigrants | Central America | 0.0 /100 | #289 | Tragic 5.3% |
| Sioux | 0.0 /100 | #290 | Tragic 5.3% |
| Trinidadians and Tobagonians | 0.0 /100 | #291 | Tragic 5.3% |
| British West Indians | 0.0 /100 | #292 | Tragic 5.3% |
| Immigrants | Grenada | 0.0 /100 | #293 | Tragic 5.3% |
| Cajuns | 0.0 /100 | #294 | Tragic 5.3% |
| Dutch West Indians | 0.0 /100 | #295 | Tragic 5.3% |
| Barbadians | 0.0 /100 | #296 | Tragic 5.3% |
| Immigrants | Mexico | 0.0 /100 | #297 | Tragic 5.3% |
| Hispanics or Latinos | 0.0 /100 | #298 | Tragic 5.4% |
| Cape Verdeans | 0.0 /100 | #299 | Tragic 5.4% |
| Immigrants | St. Vincent and the Grenadines | 0.0 /100 | #300 | Tragic 5.4% |
| Immigrants | Dominica | 0.0 /100 | #301 | Tragic 5.5% |