Immigrants from Bahamas vs Arab Unemployment Among Ages 20 to 24 years
COMPARE
Immigrants from Bahamas
Arab
Unemployment Among Ages 20 to 24 years
Unemployment Among Ages 20 to 24 years Comparison
Immigrants from Bahamas
Arabs
10.9%
UNEMPLOYMENT AMONG AGES 20 TO 24 YEARS
0.3/ 100
METRIC RATING
256th/ 347
METRIC RANK
10.6%
UNEMPLOYMENT AMONG AGES 20 TO 24 YEARS
5.6/ 100
METRIC RATING
223rd/ 347
METRIC RANK
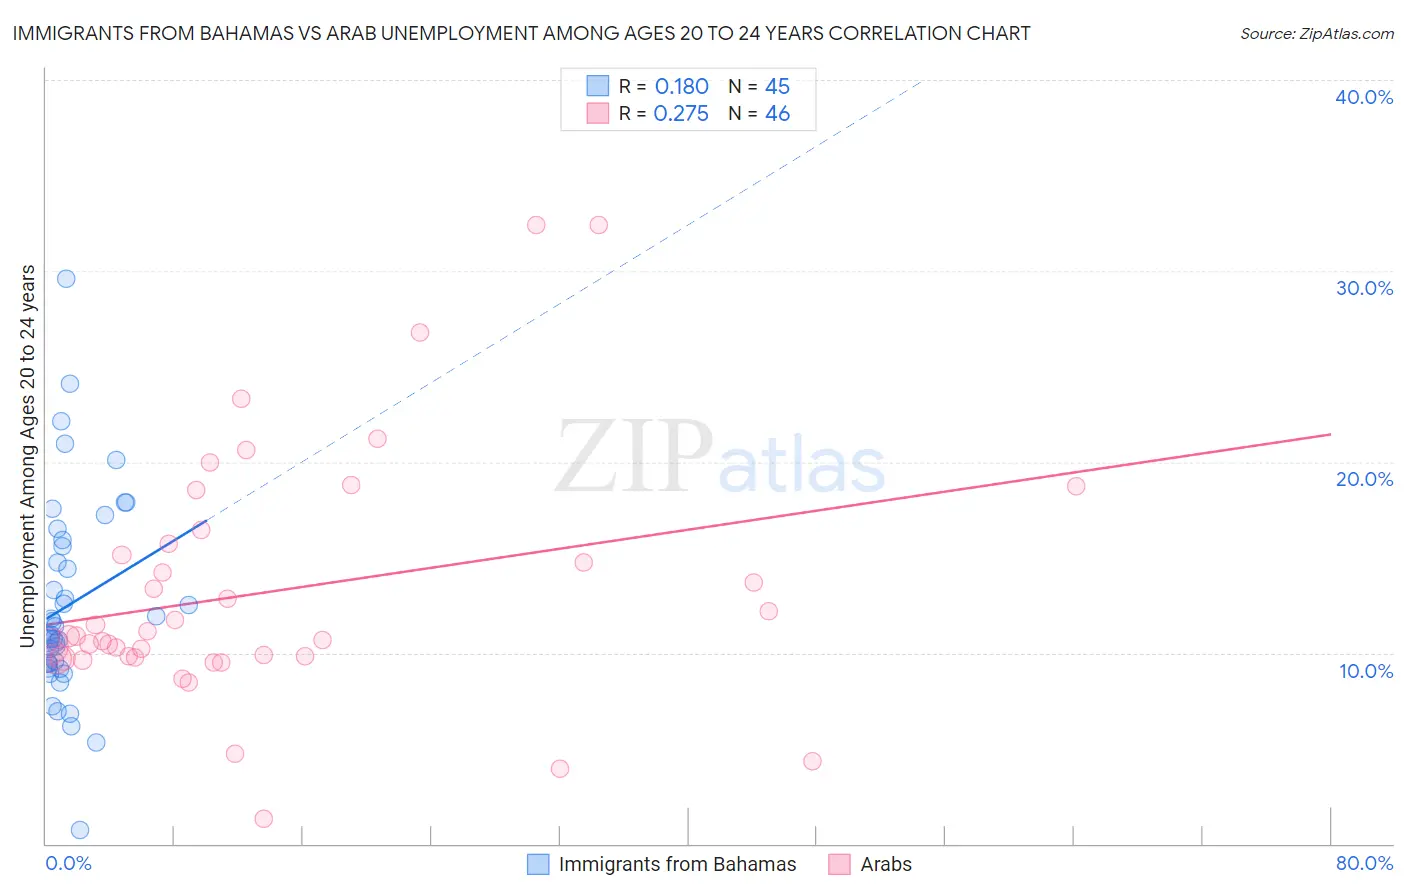
Immigrants from Bahamas vs Arab Unemployment Among Ages 20 to 24 years Correlation Chart
The statistical analysis conducted on geographies consisting of 103,665,491 people shows a poor positive correlation between the proportion of Immigrants from Bahamas and unemployment rate among population between the ages 20 and 24 in the United States with a correlation coefficient (R) of 0.180 and weighted average of 10.9%. Similarly, the statistical analysis conducted on geographies consisting of 465,698,977 people shows a weak positive correlation between the proportion of Arabs and unemployment rate among population between the ages 20 and 24 in the United States with a correlation coefficient (R) of 0.275 and weighted average of 10.6%, a difference of 2.7%.
Unemployment Among Ages 20 to 24 years Correlation Summary
| Measurement | Immigrants from Bahamas | Arab |
| Minimum | 0.70% | 1.3% |
| Maximum | 29.6% | 32.4% |
| Range | 28.9% | 31.1% |
| Mean | 12.5% | 13.2% |
| Median | 11.0% | 10.9% |
| Interquartile 25% (IQ1) | 9.3% | 9.8% |
| Interquartile 75% (IQ3) | 15.7% | 15.7% |
| Interquartile Range (IQR) | 6.4% | 6.0% |
| Standard Deviation (Sample) | 5.3% | 6.5% |
| Standard Deviation (Population) | 5.3% | 6.4% |
Similar Demographics by Unemployment Among Ages 20 to 24 years
Demographics Similar to Immigrants from Bahamas by Unemployment Among Ages 20 to 24 years
In terms of unemployment among ages 20 to 24 years, the demographic groups most similar to Immigrants from Bahamas are Immigrants from Western Asia (10.9%, a difference of 0.070%), Liberian (10.8%, a difference of 0.10%), Immigrants from Israel (10.8%, a difference of 0.10%), Dutch West Indian (10.9%, a difference of 0.14%), and Spanish American (10.8%, a difference of 0.22%).
| Demographics | Rating | Rank | Unemployment Among Ages 20 to 24 years |
| South American Indians | 0.5 /100 | #249 | Tragic 10.8% |
| Albanians | 0.5 /100 | #250 | Tragic 10.8% |
| Immigrants | Panama | 0.4 /100 | #251 | Tragic 10.8% |
| Immigrants | Syria | 0.4 /100 | #252 | Tragic 10.8% |
| Spanish Americans | 0.4 /100 | #253 | Tragic 10.8% |
| Liberians | 0.3 /100 | #254 | Tragic 10.8% |
| Immigrants | Israel | 0.3 /100 | #255 | Tragic 10.8% |
| Immigrants | Bahamas | 0.3 /100 | #256 | Tragic 10.9% |
| Immigrants | Western Asia | 0.3 /100 | #257 | Tragic 10.9% |
| Dutch West Indians | 0.3 /100 | #258 | Tragic 10.9% |
| Panamanians | 0.2 /100 | #259 | Tragic 10.9% |
| Immigrants | Lebanon | 0.2 /100 | #260 | Tragic 10.9% |
| Puget Sound Salish | 0.2 /100 | #261 | Tragic 10.9% |
| Immigrants | Latin America | 0.1 /100 | #262 | Tragic 11.0% |
| Marshallese | 0.1 /100 | #263 | Tragic 11.0% |
Demographics Similar to Arabs by Unemployment Among Ages 20 to 24 years
In terms of unemployment among ages 20 to 24 years, the demographic groups most similar to Arabs are Nepalese (10.6%, a difference of 0.090%), Immigrants from South America (10.6%, a difference of 0.10%), Immigrants from Poland (10.6%, a difference of 0.12%), Immigrants from Costa Rica (10.6%, a difference of 0.13%), and Palestinian (10.6%, a difference of 0.13%).
| Demographics | Rating | Rank | Unemployment Among Ages 20 to 24 years |
| Costa Ricans | 9.6 /100 | #216 | Tragic 10.5% |
| Cherokee | 9.3 /100 | #217 | Tragic 10.5% |
| Immigrants | Nonimmigrants | 8.8 /100 | #218 | Tragic 10.5% |
| Immigrants | Southern Europe | 8.0 /100 | #219 | Tragic 10.5% |
| Eastern Europeans | 6.9 /100 | #220 | Tragic 10.6% |
| Central Americans | 6.8 /100 | #221 | Tragic 10.6% |
| Immigrants | Poland | 6.4 /100 | #222 | Tragic 10.6% |
| Arabs | 5.6 /100 | #223 | Tragic 10.6% |
| Nepalese | 5.1 /100 | #224 | Tragic 10.6% |
| Immigrants | South America | 5.1 /100 | #225 | Tragic 10.6% |
| Immigrants | Costa Rica | 4.9 /100 | #226 | Tragic 10.6% |
| Palestinians | 4.9 /100 | #227 | Tragic 10.6% |
| Mexican American Indians | 4.6 /100 | #228 | Tragic 10.6% |
| Americans | 4.4 /100 | #229 | Tragic 10.6% |
| French American Indians | 4.1 /100 | #230 | Tragic 10.6% |