Immigrants from Australia vs Immigrants from Sweden Unemployment Among Women with Children Under 6 years
COMPARE
Immigrants from Australia
Immigrants from Sweden
Unemployment Among Women with Children Under 6 years
Unemployment Among Women with Children Under 6 years Comparison
Immigrants from Australia
Immigrants from Sweden
6.8%
UNEMPLOYMENT AMONG WOMEN WITH CHILDREN UNDER 6 YEARS
99.9/ 100
METRIC RATING
45th/ 347
METRIC RANK
6.6%
UNEMPLOYMENT AMONG WOMEN WITH CHILDREN UNDER 6 YEARS
100.0/ 100
METRIC RATING
29th/ 347
METRIC RANK
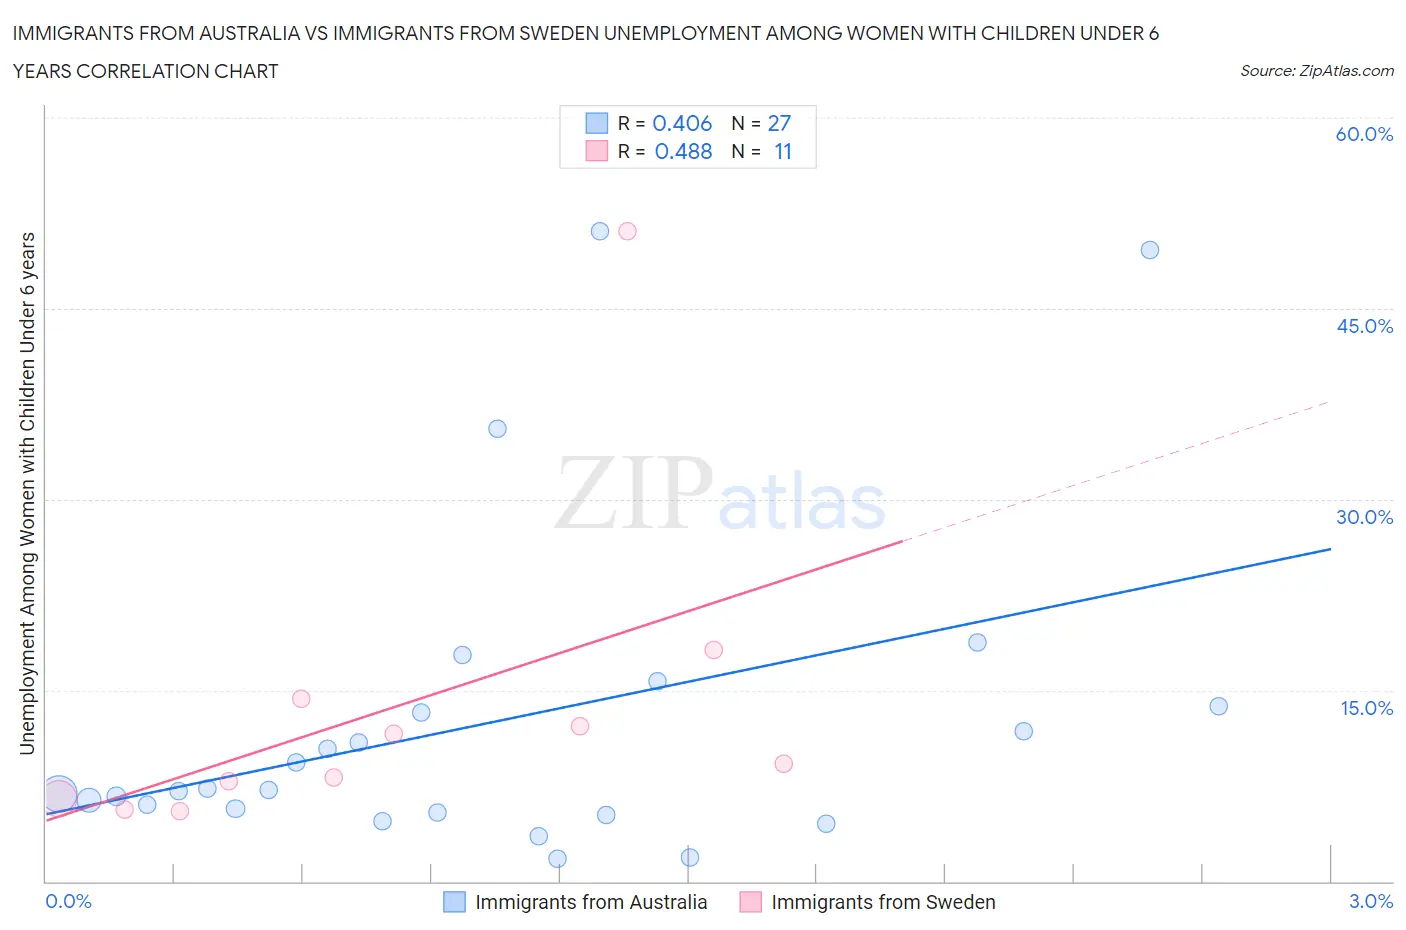
Immigrants from Australia vs Immigrants from Sweden Unemployment Among Women with Children Under 6 years Correlation Chart
The statistical analysis conducted on geographies consisting of 185,332,554 people shows a moderate positive correlation between the proportion of Immigrants from Australia and unemployment rate among women with children under the age of 6 in the United States with a correlation coefficient (R) of 0.406 and weighted average of 6.8%. Similarly, the statistical analysis conducted on geographies consisting of 138,265,511 people shows a moderate positive correlation between the proportion of Immigrants from Sweden and unemployment rate among women with children under the age of 6 in the United States with a correlation coefficient (R) of 0.488 and weighted average of 6.6%, a difference of 2.9%.
Unemployment Among Women with Children Under 6 years Correlation Summary
| Measurement | Immigrants from Australia | Immigrants from Sweden |
| Minimum | 1.8% | 5.5% |
| Maximum | 51.1% | 51.1% |
| Range | 49.3% | 45.6% |
| Mean | 12.5% | 13.7% |
| Median | 7.2% | 9.2% |
| Interquartile 25% (IQ1) | 5.4% | 6.5% |
| Interquartile 75% (IQ3) | 13.7% | 14.3% |
| Interquartile Range (IQR) | 8.3% | 7.8% |
| Standard Deviation (Sample) | 12.9% | 13.0% |
| Standard Deviation (Population) | 12.6% | 12.4% |
Demographics Similar to Immigrants from Australia and Immigrants from Sweden by Unemployment Among Women with Children Under 6 years
In terms of unemployment among women with children under 6 years, the demographic groups most similar to Immigrants from Australia are Iranian (6.7%, a difference of 0.060%), Latvian (6.8%, a difference of 0.24%), Immigrants from Asia (6.8%, a difference of 0.41%), Bhutanese (6.7%, a difference of 0.61%), and Immigrants from Cuba (6.7%, a difference of 0.89%). Similarly, the demographic groups most similar to Immigrants from Sweden are Immigrants from Israel (6.5%, a difference of 0.26%), Immigrants from Japan (6.5%, a difference of 0.28%), Immigrants from Belarus (6.6%, a difference of 0.32%), Immigrants from Moldova (6.6%, a difference of 0.61%), and Tsimshian (6.6%, a difference of 0.68%).
| Demographics | Rating | Rank | Unemployment Among Women with Children Under 6 years |
| Immigrants | Japan | 100.0 /100 | #27 | Exceptional 6.5% |
| Immigrants | Israel | 100.0 /100 | #28 | Exceptional 6.5% |
| Immigrants | Sweden | 100.0 /100 | #29 | Exceptional 6.6% |
| Immigrants | Belarus | 100.0 /100 | #30 | Exceptional 6.6% |
| Immigrants | Moldova | 100.0 /100 | #31 | Exceptional 6.6% |
| Tsimshian | 100.0 /100 | #32 | Exceptional 6.6% |
| Immigrants | Vietnam | 100.0 /100 | #33 | Exceptional 6.6% |
| Immigrants | South Central Asia | 100.0 /100 | #34 | Exceptional 6.6% |
| Yakama | 100.0 /100 | #35 | Exceptional 6.6% |
| Luxembourgers | 100.0 /100 | #36 | Exceptional 6.6% |
| Sri Lankans | 100.0 /100 | #37 | Exceptional 6.6% |
| Hmong | 100.0 /100 | #38 | Exceptional 6.7% |
| Immigrants | Russia | 100.0 /100 | #39 | Exceptional 6.7% |
| Asians | 100.0 /100 | #40 | Exceptional 6.7% |
| Immigrants | Indonesia | 99.9 /100 | #41 | Exceptional 6.7% |
| Immigrants | Cuba | 99.9 /100 | #42 | Exceptional 6.7% |
| Bhutanese | 99.9 /100 | #43 | Exceptional 6.7% |
| Iranians | 99.9 /100 | #44 | Exceptional 6.7% |
| Immigrants | Australia | 99.9 /100 | #45 | Exceptional 6.8% |
| Latvians | 99.9 /100 | #46 | Exceptional 6.8% |
| Immigrants | Asia | 99.9 /100 | #47 | Exceptional 6.8% |