Immigrants from Armenia vs Pueblo Unemployment Among Ages 20 to 24 years
COMPARE
Immigrants from Armenia
Pueblo
Unemployment Among Ages 20 to 24 years
Unemployment Among Ages 20 to 24 years Comparison
Immigrants from Armenia
Pueblo
12.0%
UNEMPLOYMENT AMONG AGES 20 TO 24 YEARS
0.0/ 100
METRIC RATING
295th/ 347
METRIC RANK
13.2%
UNEMPLOYMENT AMONG AGES 20 TO 24 YEARS
0.0/ 100
METRIC RATING
325th/ 347
METRIC RANK
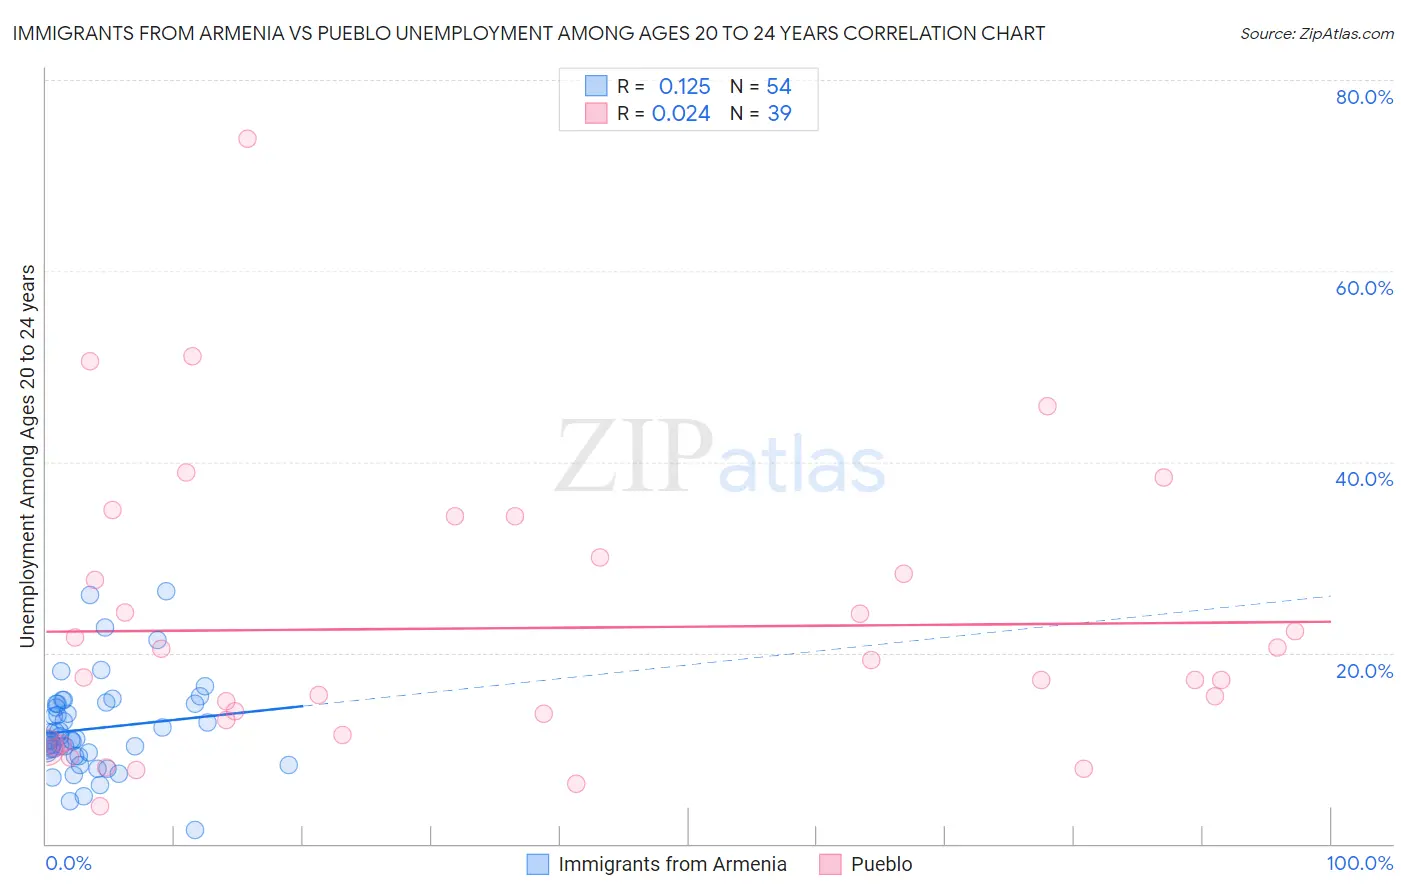
Immigrants from Armenia vs Pueblo Unemployment Among Ages 20 to 24 years Correlation Chart
The statistical analysis conducted on geographies consisting of 97,169,486 people shows a poor positive correlation between the proportion of Immigrants from Armenia and unemployment rate among population between the ages 20 and 24 in the United States with a correlation coefficient (R) of 0.125 and weighted average of 12.0%. Similarly, the statistical analysis conducted on geographies consisting of 119,037,771 people shows no correlation between the proportion of Pueblo and unemployment rate among population between the ages 20 and 24 in the United States with a correlation coefficient (R) of 0.024 and weighted average of 13.2%, a difference of 10.5%.
Unemployment Among Ages 20 to 24 years Correlation Summary
| Measurement | Immigrants from Armenia | Pueblo |
| Minimum | 1.4% | 4.0% |
| Maximum | 26.4% | 73.9% |
| Range | 25.0% | 69.9% |
| Mean | 12.1% | 22.6% |
| Median | 11.0% | 17.4% |
| Interquartile 25% (IQ1) | 9.5% | 11.4% |
| Interquartile 75% (IQ3) | 14.7% | 30.0% |
| Interquartile Range (IQR) | 5.2% | 18.6% |
| Standard Deviation (Sample) | 4.8% | 14.9% |
| Standard Deviation (Population) | 4.8% | 14.7% |
Similar Demographics by Unemployment Among Ages 20 to 24 years
Demographics Similar to Immigrants from Armenia by Unemployment Among Ages 20 to 24 years
In terms of unemployment among ages 20 to 24 years, the demographic groups most similar to Immigrants from Armenia are Cajun (12.0%, a difference of 0.030%), Blackfeet (12.0%, a difference of 0.040%), Immigrants from Belize (12.0%, a difference of 0.18%), Immigrants from Ghana (11.9%, a difference of 0.21%), and Immigrants from Senegal (11.9%, a difference of 0.44%).
| Demographics | Rating | Rank | Unemployment Among Ages 20 to 24 years |
| U.S. Virgin Islanders | 0.0 /100 | #288 | Tragic 11.8% |
| Belizeans | 0.0 /100 | #289 | Tragic 11.8% |
| Immigrants | Caribbean | 0.0 /100 | #290 | Tragic 11.8% |
| Central American Indians | 0.0 /100 | #291 | Tragic 11.9% |
| Immigrants | Senegal | 0.0 /100 | #292 | Tragic 11.9% |
| Immigrants | Ghana | 0.0 /100 | #293 | Tragic 11.9% |
| Immigrants | Belize | 0.0 /100 | #294 | Tragic 12.0% |
| Immigrants | Armenia | 0.0 /100 | #295 | Tragic 12.0% |
| Cajuns | 0.0 /100 | #296 | Tragic 12.0% |
| Blackfeet | 0.0 /100 | #297 | Tragic 12.0% |
| Lumbee | 0.0 /100 | #298 | Tragic 12.0% |
| Apache | 0.0 /100 | #299 | Tragic 12.0% |
| Spanish American Indians | 0.0 /100 | #300 | Tragic 12.1% |
| Immigrants | Sierra Leone | 0.0 /100 | #301 | Tragic 12.1% |
| Immigrants | Cabo Verde | 0.0 /100 | #302 | Tragic 12.2% |
Demographics Similar to Pueblo by Unemployment Among Ages 20 to 24 years
In terms of unemployment among ages 20 to 24 years, the demographic groups most similar to Pueblo are Alaska Native (13.2%, a difference of 0.22%), Yakama (13.1%, a difference of 1.2%), Native/Alaskan (13.0%, a difference of 1.7%), Immigrants from Barbados (13.5%, a difference of 1.7%), and Immigrants from Jamaica (13.0%, a difference of 2.1%).
| Demographics | Rating | Rank | Unemployment Among Ages 20 to 24 years |
| Barbadians | 0.0 /100 | #318 | Tragic 12.9% |
| Trinidadians and Tobagonians | 0.0 /100 | #319 | Tragic 12.9% |
| Cheyenne | 0.0 /100 | #320 | Tragic 13.0% |
| Immigrants | Jamaica | 0.0 /100 | #321 | Tragic 13.0% |
| Natives/Alaskans | 0.0 /100 | #322 | Tragic 13.0% |
| Yakama | 0.0 /100 | #323 | Tragic 13.1% |
| Alaska Natives | 0.0 /100 | #324 | Tragic 13.2% |
| Pueblo | 0.0 /100 | #325 | Tragic 13.2% |
| Immigrants | Barbados | 0.0 /100 | #326 | Tragic 13.5% |
| Immigrants | Dominican Republic | 0.0 /100 | #327 | Tragic 13.6% |
| British West Indians | 0.0 /100 | #328 | Tragic 13.7% |
| Dominicans | 0.0 /100 | #329 | Tragic 13.8% |
| Arapaho | 0.0 /100 | #330 | Tragic 13.8% |
| Aleuts | 0.0 /100 | #331 | Tragic 13.8% |
| Immigrants | Grenada | 0.0 /100 | #332 | Tragic 13.8% |