Immigrants from Armenia vs Immigrants from Uruguay Unemployment Among Ages 65 to 74 years
COMPARE
Immigrants from Armenia
Immigrants from Uruguay
Unemployment Among Ages 65 to 74 years
Unemployment Among Ages 65 to 74 years Comparison
Immigrants from Armenia
Immigrants from Uruguay
6.5%
UNEMPLOYMENT AMONG AGES 65 TO 74 YEARS
0.0/ 100
METRIC RATING
336th/ 347
METRIC RANK
5.5%
UNEMPLOYMENT AMONG AGES 65 TO 74 YEARS
4.2/ 100
METRIC RATING
224th/ 347
METRIC RANK
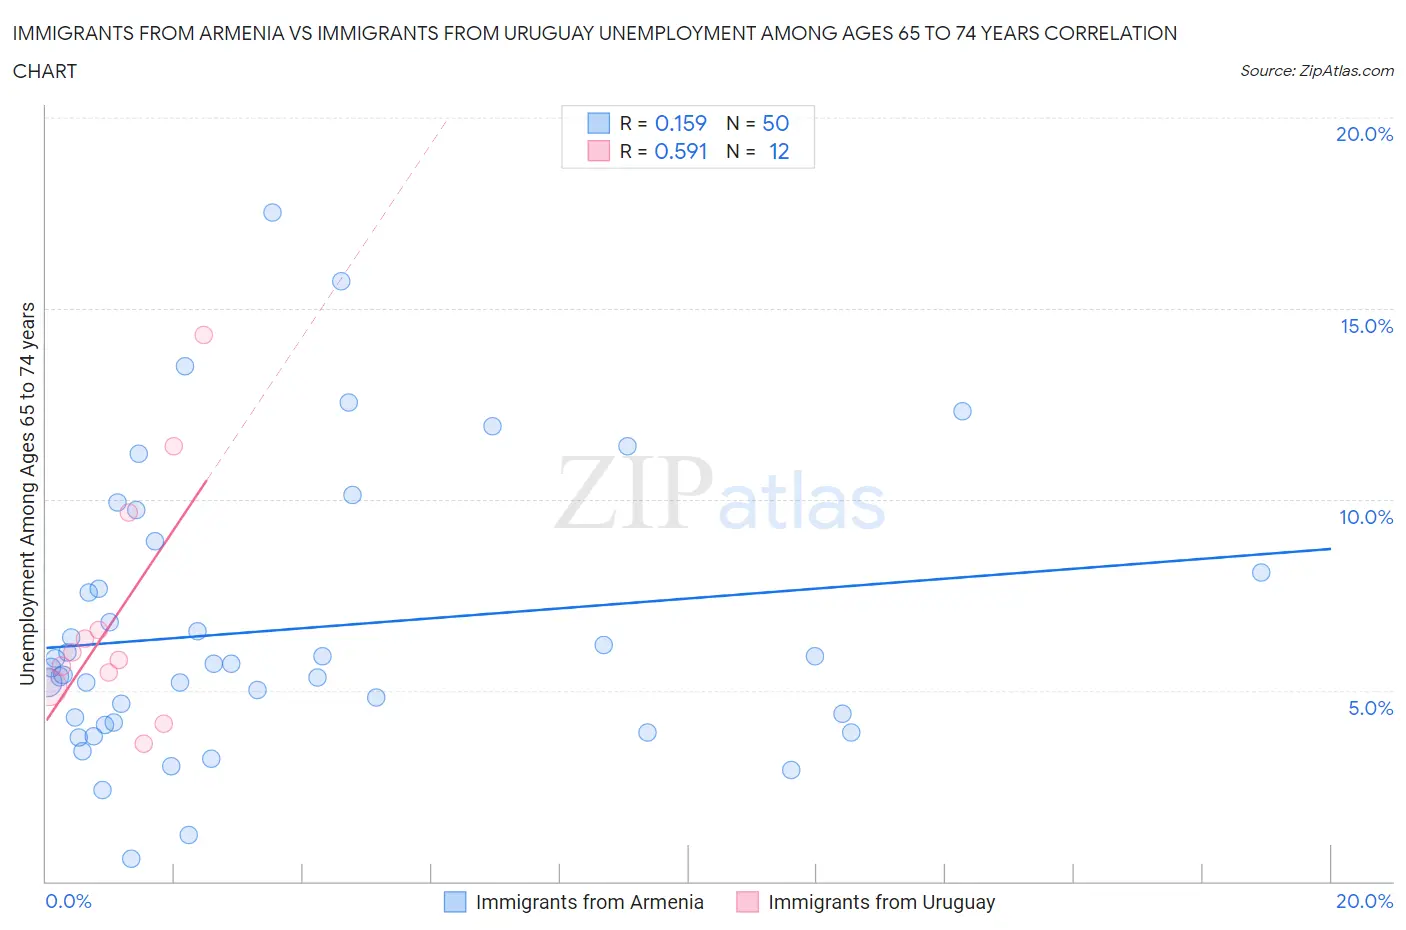
Immigrants from Armenia vs Immigrants from Uruguay Unemployment Among Ages 65 to 74 years Correlation Chart
The statistical analysis conducted on geographies consisting of 94,978,912 people shows a poor positive correlation between the proportion of Immigrants from Armenia and unemployment rate among population between the ages 65 and 74 in the United States with a correlation coefficient (R) of 0.159 and weighted average of 6.5%. Similarly, the statistical analysis conducted on geographies consisting of 127,772,311 people shows a substantial positive correlation between the proportion of Immigrants from Uruguay and unemployment rate among population between the ages 65 and 74 in the United States with a correlation coefficient (R) of 0.591 and weighted average of 5.5%, a difference of 17.7%.
Unemployment Among Ages 65 to 74 years Correlation Summary
| Measurement | Immigrants from Armenia | Immigrants from Uruguay |
| Minimum | 0.60% | 3.6% |
| Maximum | 17.5% | 14.3% |
| Range | 16.9% | 10.7% |
| Mean | 6.6% | 7.0% |
| Median | 5.6% | 5.9% |
| Interquartile 25% (IQ1) | 4.2% | 5.3% |
| Interquartile 75% (IQ3) | 8.1% | 8.1% |
| Interquartile Range (IQR) | 3.9% | 2.8% |
| Standard Deviation (Sample) | 3.6% | 3.2% |
| Standard Deviation (Population) | 3.6% | 3.0% |
Similar Demographics by Unemployment Among Ages 65 to 74 years
Demographics Similar to Immigrants from Armenia by Unemployment Among Ages 65 to 74 years
In terms of unemployment among ages 65 to 74 years, the demographic groups most similar to Immigrants from Armenia are Ute (6.5%, a difference of 0.76%), Tlingit-Haida (6.5%, a difference of 0.85%), Yakama (6.6%, a difference of 1.2%), Puerto Rican (6.4%, a difference of 1.6%), and Pima (6.6%, a difference of 2.1%).
| Demographics | Rating | Rank | Unemployment Among Ages 65 to 74 years |
| Yuman | 0.0 /100 | #329 | Tragic 6.2% |
| Dominicans | 0.0 /100 | #330 | Tragic 6.3% |
| Bermudans | 0.0 /100 | #331 | Tragic 6.3% |
| Immigrants | Dominican Republic | 0.0 /100 | #332 | Tragic 6.3% |
| Paiute | 0.0 /100 | #333 | Tragic 6.3% |
| Taiwanese | 0.0 /100 | #334 | Tragic 6.3% |
| Puerto Ricans | 0.0 /100 | #335 | Tragic 6.4% |
| Immigrants | Armenia | 0.0 /100 | #336 | Tragic 6.5% |
| Ute | 0.0 /100 | #337 | Tragic 6.5% |
| Tlingit-Haida | 0.0 /100 | #338 | Tragic 6.5% |
| Yakama | 0.0 /100 | #339 | Tragic 6.6% |
| Pima | 0.0 /100 | #340 | Tragic 6.6% |
| Alaska Natives | 0.0 /100 | #341 | Tragic 6.8% |
| Navajo | 0.0 /100 | #342 | Tragic 6.9% |
| Alaskan Athabascans | 0.0 /100 | #343 | Tragic 7.4% |
Demographics Similar to Immigrants from Uruguay by Unemployment Among Ages 65 to 74 years
In terms of unemployment among ages 65 to 74 years, the demographic groups most similar to Immigrants from Uruguay are Immigrants from Trinidad and Tobago (5.5%, a difference of 0.010%), Hungarian (5.5%, a difference of 0.050%), Apache (5.5%, a difference of 0.070%), Honduran (5.5%, a difference of 0.10%), and Immigrants from Albania (5.5%, a difference of 0.10%).
| Demographics | Rating | Rank | Unemployment Among Ages 65 to 74 years |
| Blackfeet | 5.8 /100 | #217 | Tragic 5.5% |
| Samoans | 5.7 /100 | #218 | Tragic 5.5% |
| Alsatians | 5.6 /100 | #219 | Tragic 5.5% |
| Immigrants | Syria | 5.1 /100 | #220 | Tragic 5.5% |
| Spaniards | 4.8 /100 | #221 | Tragic 5.5% |
| Apache | 4.5 /100 | #222 | Tragic 5.5% |
| Hungarians | 4.4 /100 | #223 | Tragic 5.5% |
| Immigrants | Uruguay | 4.2 /100 | #224 | Tragic 5.5% |
| Immigrants | Trinidad and Tobago | 4.1 /100 | #225 | Tragic 5.5% |
| Hondurans | 3.7 /100 | #226 | Tragic 5.5% |
| Immigrants | Albania | 3.7 /100 | #227 | Tragic 5.5% |
| Immigrants | Israel | 3.0 /100 | #228 | Tragic 5.5% |
| West Indians | 2.7 /100 | #229 | Tragic 5.5% |
| Immigrants | Caribbean | 2.7 /100 | #230 | Tragic 5.5% |
| Israelis | 2.5 /100 | #231 | Tragic 5.5% |