Immigrants from Armenia vs Dutch Unemployment Among Ages 25 to 29 years
COMPARE
Immigrants from Armenia
Dutch
Unemployment Among Ages 25 to 29 years
Unemployment Among Ages 25 to 29 years Comparison
Immigrants from Armenia
Dutch
8.5%
UNEMPLOYMENT AMONG AGES 25 TO 29 YEARS
0.0/ 100
METRIC RATING
319th/ 347
METRIC RANK
6.5%
UNEMPLOYMENT AMONG AGES 25 TO 29 YEARS
80.6/ 100
METRIC RATING
127th/ 347
METRIC RANK
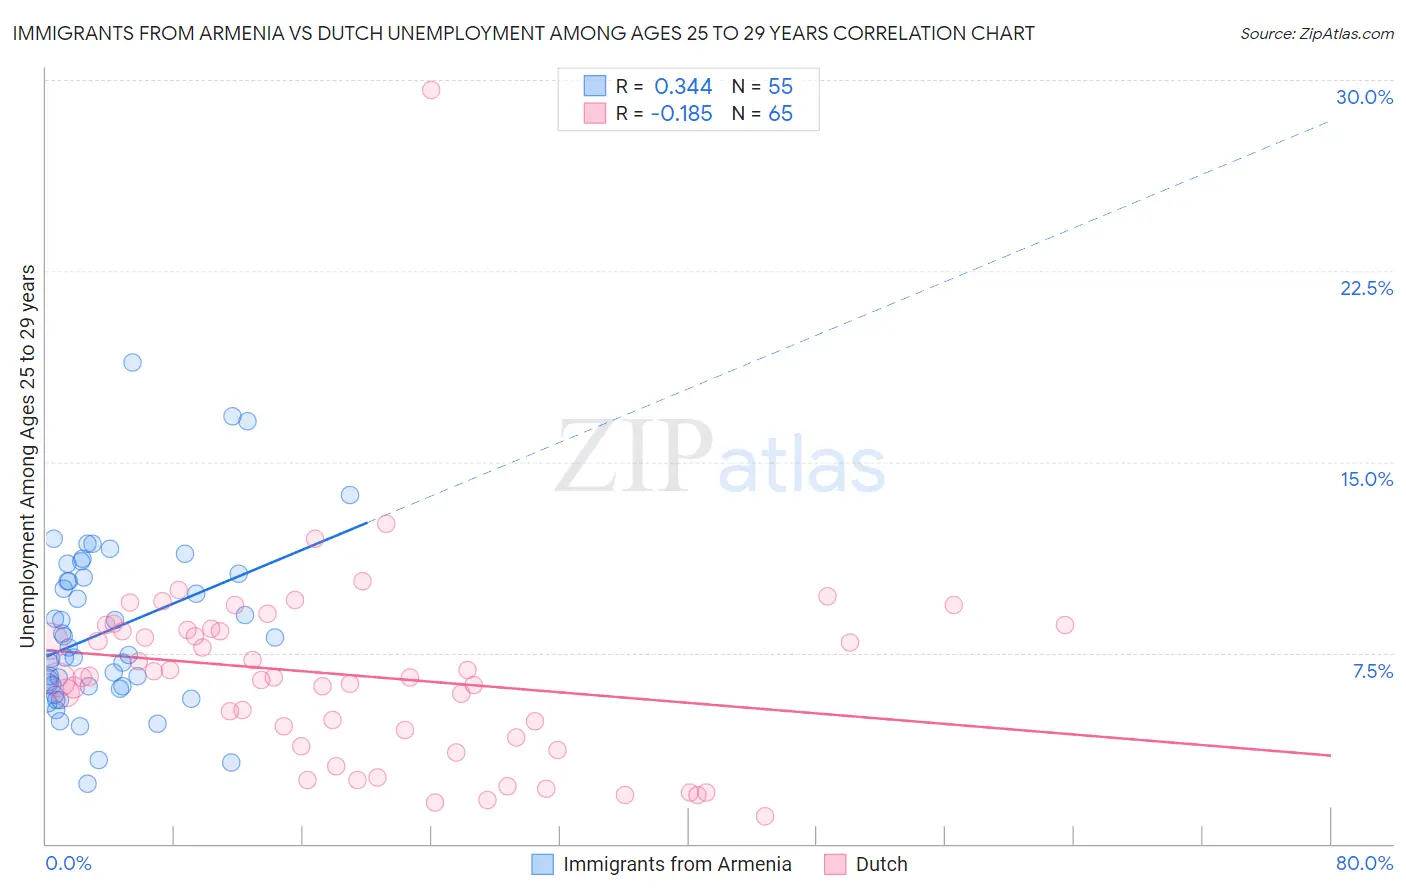
Immigrants from Armenia vs Dutch Unemployment Among Ages 25 to 29 years Correlation Chart
The statistical analysis conducted on geographies consisting of 96,699,848 people shows a mild positive correlation between the proportion of Immigrants from Armenia and unemployment rate among population between the ages 25 and 29 in the United States with a correlation coefficient (R) of 0.344 and weighted average of 8.5%. Similarly, the statistical analysis conducted on geographies consisting of 494,818,360 people shows a poor negative correlation between the proportion of Dutch and unemployment rate among population between the ages 25 and 29 in the United States with a correlation coefficient (R) of -0.185 and weighted average of 6.5%, a difference of 30.7%.
Unemployment Among Ages 25 to 29 years Correlation Summary
| Measurement | Immigrants from Armenia | Dutch |
| Minimum | 2.4% | 1.1% |
| Maximum | 18.9% | 29.6% |
| Range | 16.5% | 28.5% |
| Mean | 8.4% | 6.6% |
| Median | 7.4% | 6.5% |
| Interquartile 25% (IQ1) | 6.2% | 4.0% |
| Interquartile 75% (IQ3) | 10.5% | 8.4% |
| Interquartile Range (IQR) | 4.3% | 4.4% |
| Standard Deviation (Sample) | 3.3% | 4.0% |
| Standard Deviation (Population) | 3.3% | 4.0% |
Similar Demographics by Unemployment Among Ages 25 to 29 years
Demographics Similar to Immigrants from Armenia by Unemployment Among Ages 25 to 29 years
In terms of unemployment among ages 25 to 29 years, the demographic groups most similar to Immigrants from Armenia are Guyanese (8.5%, a difference of 0.23%), Immigrants from Guyana (8.5%, a difference of 0.48%), Immigrants from Grenada (8.4%, a difference of 0.57%), British West Indian (8.4%, a difference of 0.64%), and Black/African American (8.6%, a difference of 0.74%).
| Demographics | Rating | Rank | Unemployment Among Ages 25 to 29 years |
| Dutch West Indians | 0.0 /100 | #312 | Tragic 8.2% |
| Immigrants | St. Vincent and the Grenadines | 0.0 /100 | #313 | Tragic 8.4% |
| Immigrants | Dominica | 0.0 /100 | #314 | Tragic 8.4% |
| British West Indians | 0.0 /100 | #315 | Tragic 8.4% |
| Immigrants | Grenada | 0.0 /100 | #316 | Tragic 8.4% |
| Immigrants | Guyana | 0.0 /100 | #317 | Tragic 8.5% |
| Guyanese | 0.0 /100 | #318 | Tragic 8.5% |
| Immigrants | Armenia | 0.0 /100 | #319 | Tragic 8.5% |
| Blacks/African Americans | 0.0 /100 | #320 | Tragic 8.6% |
| Immigrants | Dominican Republic | 0.0 /100 | #321 | Tragic 8.6% |
| Tlingit-Haida | 0.0 /100 | #322 | Tragic 8.7% |
| Dominicans | 0.0 /100 | #323 | Tragic 8.7% |
| Houma | 0.0 /100 | #324 | Tragic 8.7% |
| Yakama | 0.0 /100 | #325 | Tragic 8.8% |
| Shoshone | 0.0 /100 | #326 | Tragic 9.2% |
Demographics Similar to Dutch by Unemployment Among Ages 25 to 29 years
In terms of unemployment among ages 25 to 29 years, the demographic groups most similar to Dutch are Immigrants from Chile (6.5%, a difference of 0.020%), Sri Lankan (6.5%, a difference of 0.040%), Immigrants from Peru (6.5%, a difference of 0.070%), Brazilian (6.5%, a difference of 0.13%), and Immigrants from Afghanistan (6.5%, a difference of 0.14%).
| Demographics | Rating | Rank | Unemployment Among Ages 25 to 29 years |
| Immigrants | Moldova | 84.5 /100 | #120 | Excellent 6.5% |
| Immigrants | Uganda | 84.5 /100 | #121 | Excellent 6.5% |
| Immigrants | Belarus | 83.7 /100 | #122 | Excellent 6.5% |
| Laotians | 83.6 /100 | #123 | Excellent 6.5% |
| Arabs | 82.5 /100 | #124 | Excellent 6.5% |
| Syrians | 82.1 /100 | #125 | Excellent 6.5% |
| Brazilians | 81.9 /100 | #126 | Excellent 6.5% |
| Dutch | 80.6 /100 | #127 | Excellent 6.5% |
| Immigrants | Chile | 80.5 /100 | #128 | Excellent 6.5% |
| Sri Lankans | 80.3 /100 | #129 | Excellent 6.5% |
| Immigrants | Peru | 79.9 /100 | #130 | Good 6.5% |
| Immigrants | Afghanistan | 79.2 /100 | #131 | Good 6.5% |
| Poles | 76.6 /100 | #132 | Good 6.5% |
| Immigrants | Europe | 75.7 /100 | #133 | Good 6.5% |
| Immigrants | Vietnam | 75.6 /100 | #134 | Good 6.5% |