Immigrants from Armenia vs Comanche Unemployment Among Women with Children Under 18 years
COMPARE
Immigrants from Armenia
Comanche
Unemployment Among Women with Children Under 18 years
Unemployment Among Women with Children Under 18 years Comparison
Immigrants from Armenia
Comanche
6.5%
UNEMPLOYMENT AMONG WOMEN WITH CHILDREN UNDER 18 YEARS
0.0/ 100
METRIC RATING
302nd/ 347
METRIC RANK
6.1%
UNEMPLOYMENT AMONG WOMEN WITH CHILDREN UNDER 18 YEARS
0.1/ 100
METRIC RATING
264th/ 347
METRIC RANK
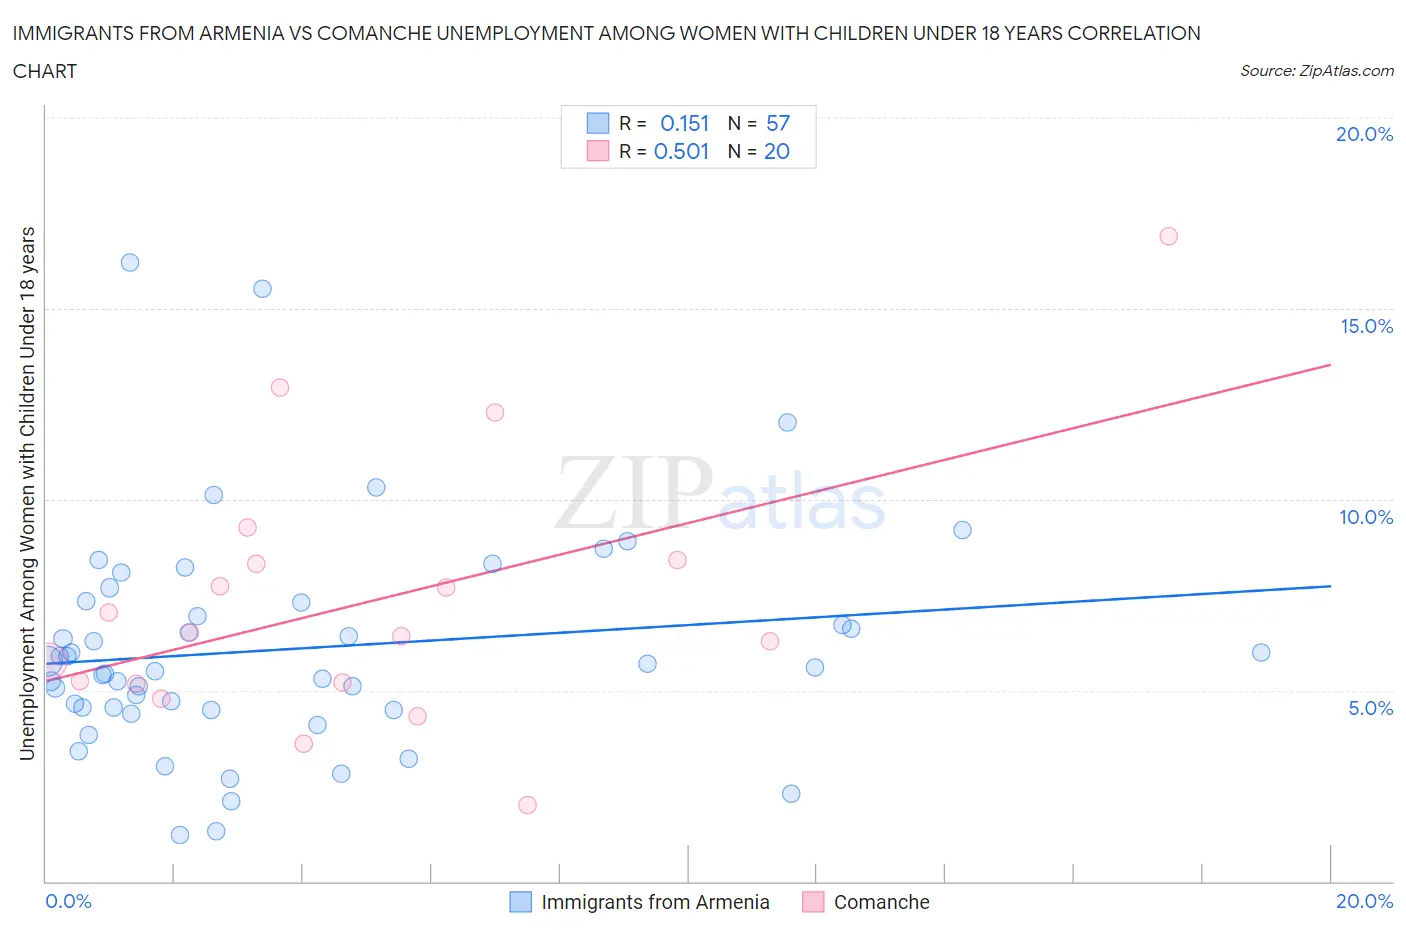
Immigrants from Armenia vs Comanche Unemployment Among Women with Children Under 18 years Correlation Chart
The statistical analysis conducted on geographies consisting of 96,707,530 people shows a poor positive correlation between the proportion of Immigrants from Armenia and unemployment rate among women with children under the age of 18 in the United States with a correlation coefficient (R) of 0.151 and weighted average of 6.5%. Similarly, the statistical analysis conducted on geographies consisting of 107,484,576 people shows a substantial positive correlation between the proportion of Comanche and unemployment rate among women with children under the age of 18 in the United States with a correlation coefficient (R) of 0.501 and weighted average of 6.1%, a difference of 5.1%.
Unemployment Among Women with Children Under 18 years Correlation Summary
| Measurement | Immigrants from Armenia | Comanche |
| Minimum | 1.2% | 2.0% |
| Maximum | 16.2% | 16.9% |
| Range | 15.0% | 14.9% |
| Mean | 6.1% | 7.3% |
| Median | 5.6% | 6.5% |
| Interquartile 25% (IQ1) | 4.5% | 5.2% |
| Interquartile 75% (IQ3) | 7.3% | 8.3% |
| Interquartile Range (IQR) | 2.8% | 3.2% |
| Standard Deviation (Sample) | 2.9% | 3.5% |
| Standard Deviation (Population) | 2.9% | 3.4% |
Similar Demographics by Unemployment Among Women with Children Under 18 years
Demographics Similar to Immigrants from Armenia by Unemployment Among Women with Children Under 18 years
In terms of unemployment among women with children under 18 years, the demographic groups most similar to Immigrants from Armenia are Immigrants from Honduras (6.5%, a difference of 0.23%), Vietnamese (6.5%, a difference of 0.24%), Immigrants from Haiti (6.4%, a difference of 0.25%), Immigrants from Jamaica (6.4%, a difference of 0.30%), and Jamaican (6.4%, a difference of 0.44%).
| Demographics | Rating | Rank | Unemployment Among Women with Children Under 18 years |
| Barbadians | 0.0 /100 | #295 | Tragic 6.4% |
| Haitians | 0.0 /100 | #296 | Tragic 6.4% |
| Immigrants | Senegal | 0.0 /100 | #297 | Tragic 6.4% |
| Immigrants | Latin America | 0.0 /100 | #298 | Tragic 6.4% |
| Jamaicans | 0.0 /100 | #299 | Tragic 6.4% |
| Immigrants | Jamaica | 0.0 /100 | #300 | Tragic 6.4% |
| Immigrants | Haiti | 0.0 /100 | #301 | Tragic 6.4% |
| Immigrants | Armenia | 0.0 /100 | #302 | Tragic 6.5% |
| Immigrants | Honduras | 0.0 /100 | #303 | Tragic 6.5% |
| Vietnamese | 0.0 /100 | #304 | Tragic 6.5% |
| Immigrants | Central America | 0.0 /100 | #305 | Tragic 6.5% |
| Immigrants | Guyana | 0.0 /100 | #306 | Tragic 6.5% |
| Belizeans | 0.0 /100 | #307 | Tragic 6.5% |
| Africans | 0.0 /100 | #308 | Tragic 6.5% |
| Ecuadorians | 0.0 /100 | #309 | Tragic 6.5% |
Demographics Similar to Comanche by Unemployment Among Women with Children Under 18 years
In terms of unemployment among women with children under 18 years, the demographic groups most similar to Comanche are Spanish American Indian (6.1%, a difference of 0.070%), Immigrants from Liberia (6.1%, a difference of 0.090%), Immigrants from Trinidad and Tobago (6.1%, a difference of 0.090%), Immigrants from Bahamas (6.1%, a difference of 0.16%), and Nigerian (6.1%, a difference of 0.19%).
| Demographics | Rating | Rank | Unemployment Among Women with Children Under 18 years |
| Bermudans | 0.1 /100 | #257 | Tragic 6.1% |
| Immigrants | Nigeria | 0.1 /100 | #258 | Tragic 6.1% |
| Ottawa | 0.1 /100 | #259 | Tragic 6.1% |
| Nigerians | 0.1 /100 | #260 | Tragic 6.1% |
| Immigrants | Liberia | 0.1 /100 | #261 | Tragic 6.1% |
| Immigrants | Trinidad and Tobago | 0.1 /100 | #262 | Tragic 6.1% |
| Spanish American Indians | 0.1 /100 | #263 | Tragic 6.1% |
| Comanche | 0.1 /100 | #264 | Tragic 6.1% |
| Immigrants | Bahamas | 0.1 /100 | #265 | Tragic 6.1% |
| Sub-Saharan Africans | 0.1 /100 | #266 | Tragic 6.2% |
| French American Indians | 0.1 /100 | #267 | Tragic 6.2% |
| Trinidadians and Tobagonians | 0.1 /100 | #268 | Tragic 6.2% |
| Cajuns | 0.1 /100 | #269 | Tragic 6.2% |
| Ghanaians | 0.1 /100 | #270 | Tragic 6.2% |
| Central Americans | 0.0 /100 | #271 | Tragic 6.2% |