Immigrants from Albania vs Brazilian Unemployment Among Ages 35 to 44 years
COMPARE
Immigrants from Albania
Brazilian
Unemployment Among Ages 35 to 44 years
Unemployment Among Ages 35 to 44 years Comparison
Immigrants from Albania
Brazilians
4.8%
UNEMPLOYMENT AMONG AGES 35 TO 44 YEARS
30.5/ 100
METRIC RATING
192nd/ 347
METRIC RANK
4.7%
UNEMPLOYMENT AMONG AGES 35 TO 44 YEARS
39.5/ 100
METRIC RATING
181st/ 347
METRIC RANK
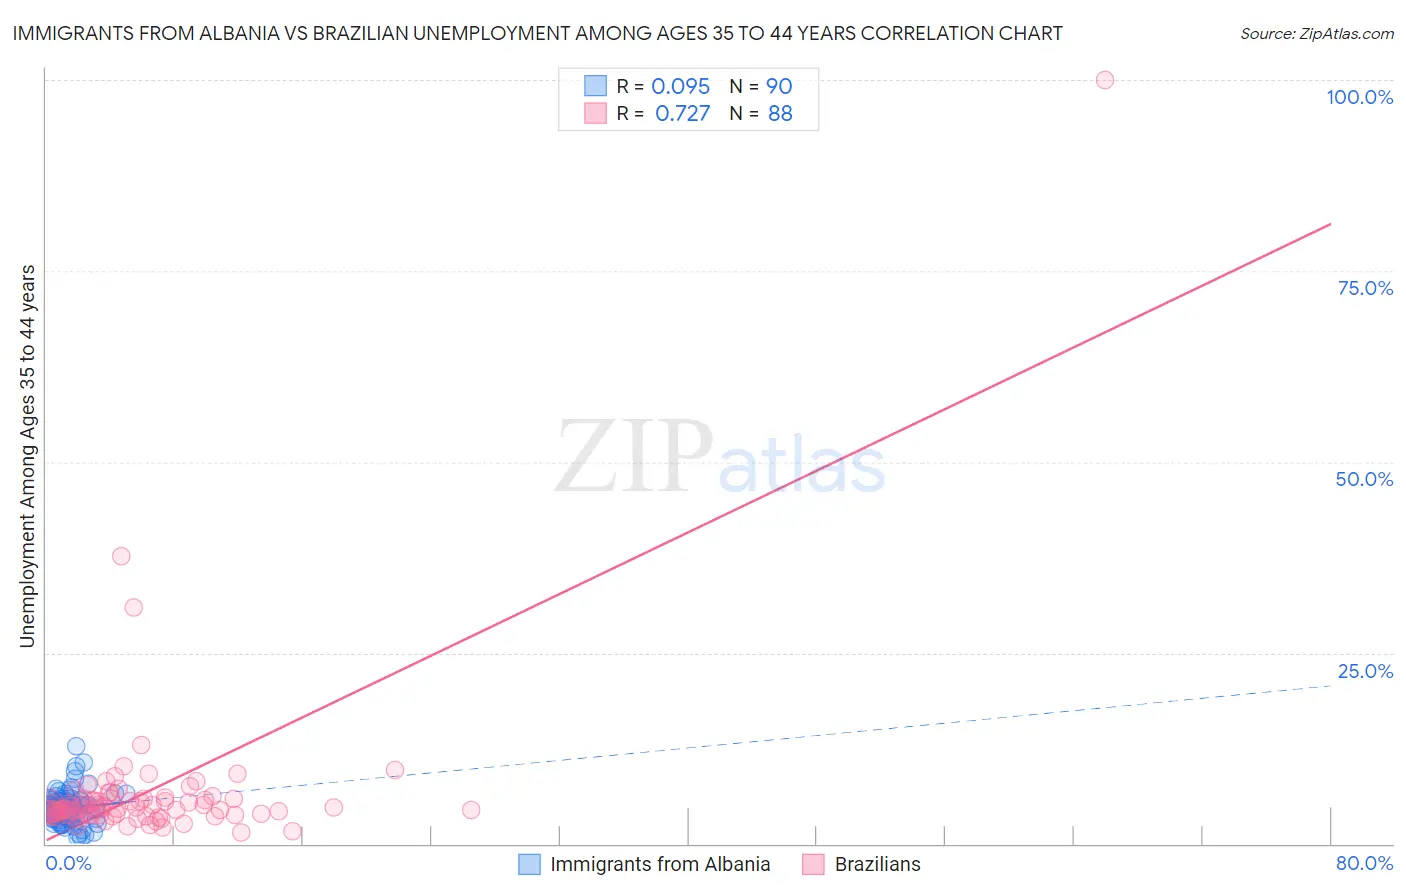
Immigrants from Albania vs Brazilian Unemployment Among Ages 35 to 44 years Correlation Chart
The statistical analysis conducted on geographies consisting of 118,529,524 people shows a slight positive correlation between the proportion of Immigrants from Albania and unemployment rate among population between the ages 35 and 44 in the United States with a correlation coefficient (R) of 0.095 and weighted average of 4.8%. Similarly, the statistical analysis conducted on geographies consisting of 318,182,129 people shows a strong positive correlation between the proportion of Brazilians and unemployment rate among population between the ages 35 and 44 in the United States with a correlation coefficient (R) of 0.727 and weighted average of 4.7%, a difference of 0.70%.
Unemployment Among Ages 35 to 44 years Correlation Summary
| Measurement | Immigrants from Albania | Brazilian |
| Minimum | 0.80% | 1.5% |
| Maximum | 12.8% | 100.0% |
| Range | 12.0% | 98.5% |
| Mean | 4.7% | 6.7% |
| Median | 4.5% | 4.6% |
| Interquartile 25% (IQ1) | 3.5% | 3.8% |
| Interquartile 75% (IQ3) | 5.5% | 5.9% |
| Interquartile Range (IQR) | 2.0% | 2.1% |
| Standard Deviation (Sample) | 2.0% | 11.2% |
| Standard Deviation (Population) | 2.0% | 11.1% |
Demographics Similar to Immigrants from Albania and Brazilians by Unemployment Among Ages 35 to 44 years
In terms of unemployment among ages 35 to 44 years, the demographic groups most similar to Immigrants from Albania are Spanish (4.8%, a difference of 0.010%), Korean (4.8%, a difference of 0.20%), Bangladeshi (4.8%, a difference of 0.21%), Immigrants from South America (4.7%, a difference of 0.26%), and Immigrants from Southern Europe (4.7%, a difference of 0.27%). Similarly, the demographic groups most similar to Brazilians are Immigrants from Peru (4.7%, a difference of 0.020%), Immigrants from South Eastern Asia (4.7%, a difference of 0.050%), South American Indian (4.7%, a difference of 0.080%), Israeli (4.7%, a difference of 0.080%), and Immigrants from Poland (4.7%, a difference of 0.12%).
| Demographics | Rating | Rank | Unemployment Among Ages 35 to 44 years |
| Immigrants | Uganda | 48.1 /100 | #176 | Average 4.7% |
| Slovaks | 44.6 /100 | #177 | Average 4.7% |
| South American Indians | 40.7 /100 | #178 | Average 4.7% |
| Immigrants | South Eastern Asia | 40.2 /100 | #179 | Average 4.7% |
| Immigrants | Peru | 39.9 /100 | #180 | Fair 4.7% |
| Brazilians | 39.5 /100 | #181 | Fair 4.7% |
| Israelis | 38.5 /100 | #182 | Fair 4.7% |
| Immigrants | Poland | 37.9 /100 | #183 | Fair 4.7% |
| Immigrants | Zaire | 37.3 /100 | #184 | Fair 4.7% |
| Immigrants | Costa Rica | 37.0 /100 | #185 | Fair 4.7% |
| Cypriots | 36.5 /100 | #186 | Fair 4.7% |
| Malaysians | 35.5 /100 | #187 | Fair 4.7% |
| Immigrants | Laos | 34.5 /100 | #188 | Fair 4.7% |
| Immigrants | Congo | 33.9 /100 | #189 | Fair 4.7% |
| Immigrants | Southern Europe | 33.8 /100 | #190 | Fair 4.7% |
| Immigrants | South America | 33.8 /100 | #191 | Fair 4.7% |
| Immigrants | Albania | 30.5 /100 | #192 | Fair 4.8% |
| Spanish | 30.4 /100 | #193 | Fair 4.8% |
| Koreans | 28.1 /100 | #194 | Fair 4.8% |
| Bangladeshis | 28.0 /100 | #195 | Fair 4.8% |
| Immigrants | Syria | 23.6 /100 | #196 | Fair 4.8% |