Immigrants from Afghanistan vs Swedish Unemployment Among Ages 25 to 29 years
COMPARE
Immigrants from Afghanistan
Swedish
Unemployment Among Ages 25 to 29 years
Unemployment Among Ages 25 to 29 years Comparison
Immigrants from Afghanistan
Swedes
6.5%
UNEMPLOYMENT AMONG AGES 25 TO 29 YEARS
79.2/ 100
METRIC RATING
131st/ 347
METRIC RANK
6.2%
UNEMPLOYMENT AMONG AGES 25 TO 29 YEARS
98.8/ 100
METRIC RATING
54th/ 347
METRIC RANK
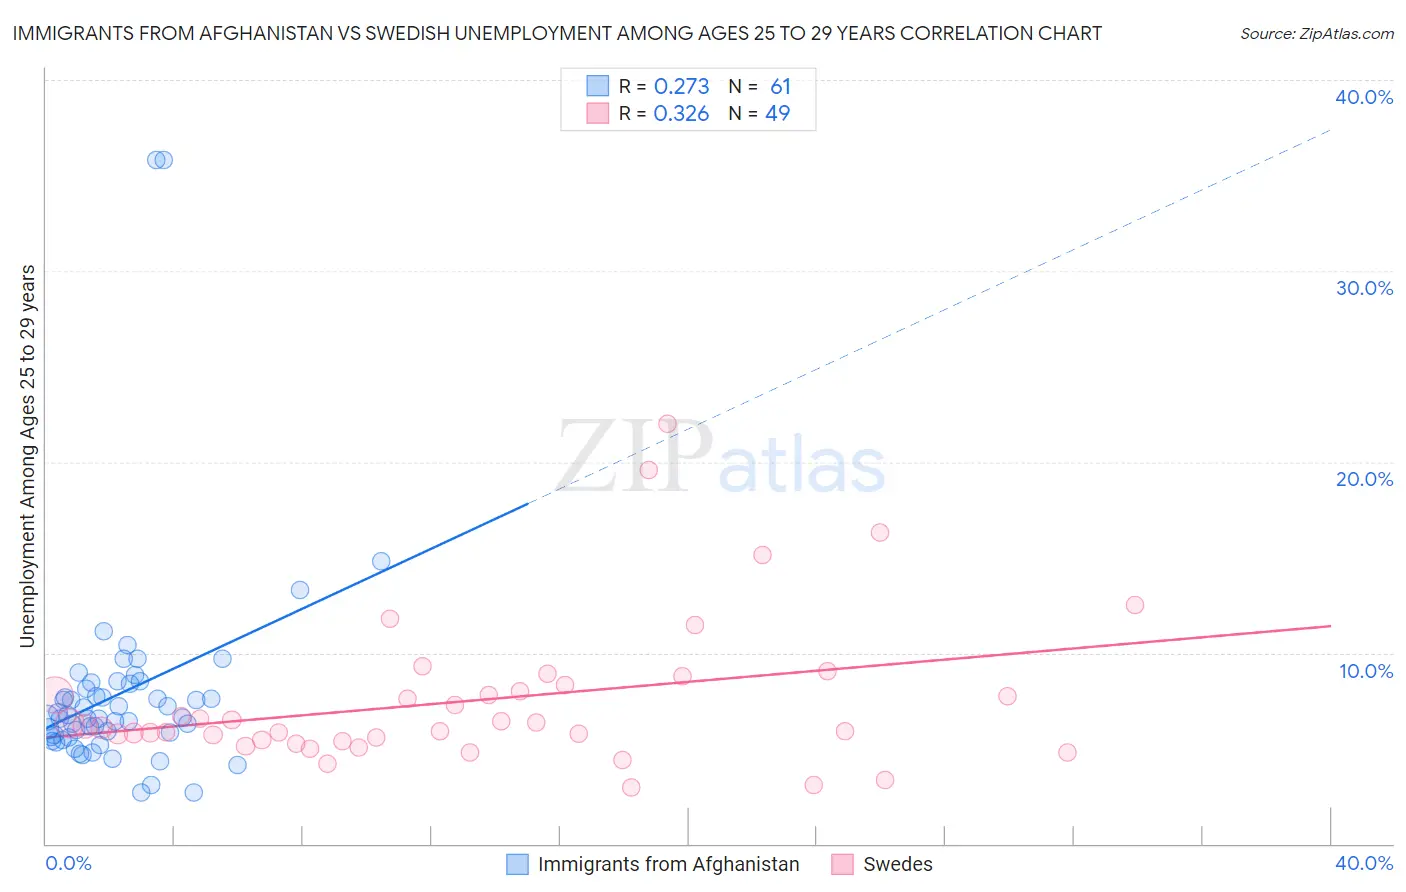
Immigrants from Afghanistan vs Swedish Unemployment Among Ages 25 to 29 years Correlation Chart
The statistical analysis conducted on geographies consisting of 146,183,722 people shows a weak positive correlation between the proportion of Immigrants from Afghanistan and unemployment rate among population between the ages 25 and 29 in the United States with a correlation coefficient (R) of 0.273 and weighted average of 6.5%. Similarly, the statistical analysis conducted on geographies consisting of 484,273,881 people shows a mild positive correlation between the proportion of Swedes and unemployment rate among population between the ages 25 and 29 in the United States with a correlation coefficient (R) of 0.326 and weighted average of 6.2%, a difference of 5.1%.
Unemployment Among Ages 25 to 29 years Correlation Summary
| Measurement | Immigrants from Afghanistan | Swedish |
| Minimum | 2.7% | 3.0% |
| Maximum | 35.8% | 22.0% |
| Range | 33.1% | 19.1% |
| Mean | 7.9% | 7.5% |
| Median | 6.6% | 6.1% |
| Interquartile 25% (IQ1) | 5.6% | 5.4% |
| Interquartile 75% (IQ3) | 8.2% | 8.1% |
| Interquartile Range (IQR) | 2.7% | 2.7% |
| Standard Deviation (Sample) | 5.6% | 3.9% |
| Standard Deviation (Population) | 5.6% | 3.8% |
Similar Demographics by Unemployment Among Ages 25 to 29 years
Demographics Similar to Immigrants from Afghanistan by Unemployment Among Ages 25 to 29 years
In terms of unemployment among ages 25 to 29 years, the demographic groups most similar to Immigrants from Afghanistan are Immigrants from Peru (6.5%, a difference of 0.070%), Sri Lankan (6.5%, a difference of 0.11%), Immigrants from Chile (6.5%, a difference of 0.13%), Dutch (6.5%, a difference of 0.14%), and Polish (6.5%, a difference of 0.23%).
| Demographics | Rating | Rank | Unemployment Among Ages 25 to 29 years |
| Arabs | 82.5 /100 | #124 | Excellent 6.5% |
| Syrians | 82.1 /100 | #125 | Excellent 6.5% |
| Brazilians | 81.9 /100 | #126 | Excellent 6.5% |
| Dutch | 80.6 /100 | #127 | Excellent 6.5% |
| Immigrants | Chile | 80.5 /100 | #128 | Excellent 6.5% |
| Sri Lankans | 80.3 /100 | #129 | Excellent 6.5% |
| Immigrants | Peru | 79.9 /100 | #130 | Good 6.5% |
| Immigrants | Afghanistan | 79.2 /100 | #131 | Good 6.5% |
| Poles | 76.6 /100 | #132 | Good 6.5% |
| Immigrants | Europe | 75.7 /100 | #133 | Good 6.5% |
| Immigrants | Vietnam | 75.6 /100 | #134 | Good 6.5% |
| Immigrants | Croatia | 75.5 /100 | #135 | Good 6.5% |
| Northern Europeans | 75.4 /100 | #136 | Good 6.5% |
| Eastern Europeans | 74.1 /100 | #137 | Good 6.5% |
| Immigrants | Belgium | 73.8 /100 | #138 | Good 6.5% |
Demographics Similar to Swedes by Unemployment Among Ages 25 to 29 years
In terms of unemployment among ages 25 to 29 years, the demographic groups most similar to Swedes are Turkish (6.2%, a difference of 0.020%), Immigrants from Turkey (6.2%, a difference of 0.080%), Burmese (6.2%, a difference of 0.12%), Soviet Union (6.2%, a difference of 0.16%), and Immigrants from Netherlands (6.2%, a difference of 0.18%).
| Demographics | Rating | Rank | Unemployment Among Ages 25 to 29 years |
| Latvians | 99.0 /100 | #47 | Exceptional 6.2% |
| Immigrants | Australia | 99.0 /100 | #48 | Exceptional 6.2% |
| German Russians | 99.0 /100 | #49 | Exceptional 6.2% |
| Soviet Union | 98.9 /100 | #50 | Exceptional 6.2% |
| Burmese | 98.9 /100 | #51 | Exceptional 6.2% |
| Immigrants | Turkey | 98.9 /100 | #52 | Exceptional 6.2% |
| Turks | 98.8 /100 | #53 | Exceptional 6.2% |
| Swedes | 98.8 /100 | #54 | Exceptional 6.2% |
| Immigrants | Netherlands | 98.7 /100 | #55 | Exceptional 6.2% |
| Immigrants | Burma/Myanmar | 98.7 /100 | #56 | Exceptional 6.2% |
| Immigrants | Saudi Arabia | 98.6 /100 | #57 | Exceptional 6.2% |
| Immigrants | Eastern Asia | 98.4 /100 | #58 | Exceptional 6.2% |
| Luxembourgers | 98.3 /100 | #59 | Exceptional 6.2% |
| Immigrants | Taiwan | 98.3 /100 | #60 | Exceptional 6.2% |
| Bhutanese | 98.2 /100 | #61 | Exceptional 6.2% |