Immigrants from Afghanistan vs Immigrants from Hungary Unemployment Among Ages 65 to 74 years
COMPARE
Immigrants from Afghanistan
Immigrants from Hungary
Unemployment Among Ages 65 to 74 years
Unemployment Among Ages 65 to 74 years Comparison
Immigrants from Afghanistan
Immigrants from Hungary
5.3%
UNEMPLOYMENT AMONG AGES 65 TO 74 YEARS
80.8/ 100
METRIC RATING
137th/ 347
METRIC RANK
5.2%
UNEMPLOYMENT AMONG AGES 65 TO 74 YEARS
98.0/ 100
METRIC RATING
84th/ 347
METRIC RANK
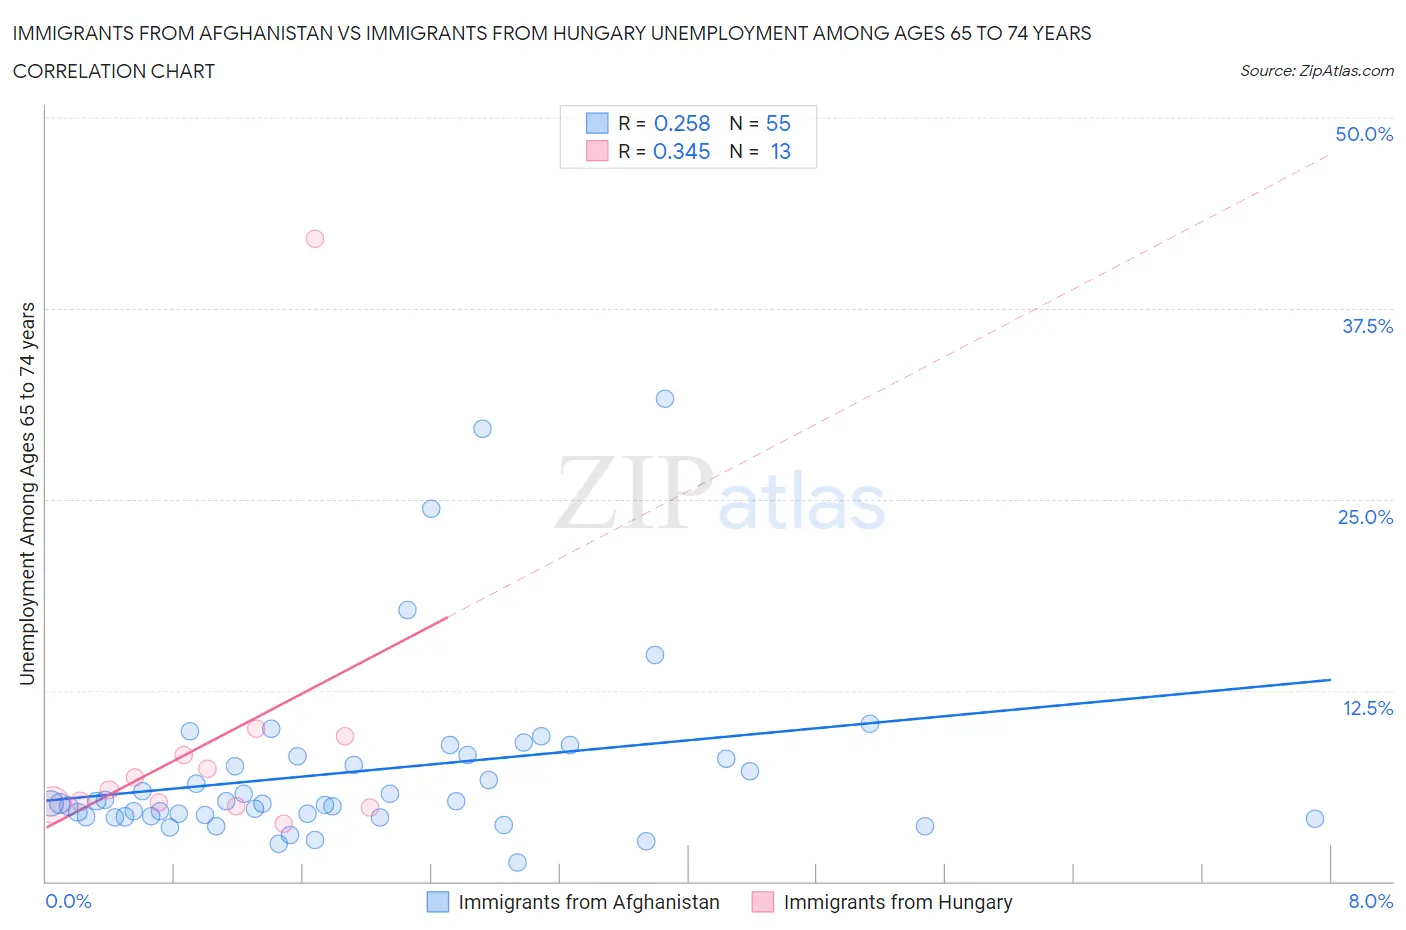
Immigrants from Afghanistan vs Immigrants from Hungary Unemployment Among Ages 65 to 74 years Correlation Chart
The statistical analysis conducted on geographies consisting of 141,256,393 people shows a weak positive correlation between the proportion of Immigrants from Afghanistan and unemployment rate among population between the ages 65 and 74 in the United States with a correlation coefficient (R) of 0.258 and weighted average of 5.3%. Similarly, the statistical analysis conducted on geographies consisting of 184,599,970 people shows a mild positive correlation between the proportion of Immigrants from Hungary and unemployment rate among population between the ages 65 and 74 in the United States with a correlation coefficient (R) of 0.345 and weighted average of 5.2%, a difference of 2.1%.
Unemployment Among Ages 65 to 74 years Correlation Summary
| Measurement | Immigrants from Afghanistan | Immigrants from Hungary |
| Minimum | 1.2% | 3.7% |
| Maximum | 31.6% | 42.1% |
| Range | 30.4% | 38.4% |
| Mean | 7.2% | 9.1% |
| Median | 5.1% | 6.0% |
| Interquartile 25% (IQ1) | 4.2% | 4.9% |
| Interquartile 75% (IQ3) | 8.2% | 8.9% |
| Interquartile Range (IQR) | 4.0% | 4.0% |
| Standard Deviation (Sample) | 6.0% | 10.1% |
| Standard Deviation (Population) | 5.9% | 9.7% |
Similar Demographics by Unemployment Among Ages 65 to 74 years
Demographics Similar to Immigrants from Afghanistan by Unemployment Among Ages 65 to 74 years
In terms of unemployment among ages 65 to 74 years, the demographic groups most similar to Immigrants from Afghanistan are Celtic (5.3%, a difference of 0.0%), Immigrants from Panama (5.3%, a difference of 0.060%), Immigrants from Serbia (5.3%, a difference of 0.060%), Chilean (5.3%, a difference of 0.060%), and Ukrainian (5.3%, a difference of 0.070%).
| Demographics | Rating | Rank | Unemployment Among Ages 65 to 74 years |
| Eastern Europeans | 85.6 /100 | #130 | Excellent 5.3% |
| Immigrants | Russia | 83.0 /100 | #131 | Excellent 5.3% |
| Koreans | 82.6 /100 | #132 | Excellent 5.3% |
| Ukrainians | 82.0 /100 | #133 | Excellent 5.3% |
| Immigrants | Panama | 81.8 /100 | #134 | Excellent 5.3% |
| Immigrants | Serbia | 81.8 /100 | #135 | Excellent 5.3% |
| Celtics | 80.8 /100 | #136 | Excellent 5.3% |
| Immigrants | Afghanistan | 80.8 /100 | #137 | Excellent 5.3% |
| Chileans | 79.7 /100 | #138 | Good 5.3% |
| Finns | 79.0 /100 | #139 | Good 5.3% |
| Immigrants | Laos | 78.6 /100 | #140 | Good 5.3% |
| Immigrants | Asia | 78.4 /100 | #141 | Good 5.3% |
| Turks | 76.2 /100 | #142 | Good 5.3% |
| New Zealanders | 76.1 /100 | #143 | Good 5.3% |
| Immigrants | Chile | 76.0 /100 | #144 | Good 5.3% |
Demographics Similar to Immigrants from Hungary by Unemployment Among Ages 65 to 74 years
In terms of unemployment among ages 65 to 74 years, the demographic groups most similar to Immigrants from Hungary are British (5.2%, a difference of 0.040%), Danish (5.2%, a difference of 0.040%), Scottish (5.2%, a difference of 0.050%), Immigrants from Saudi Arabia (5.2%, a difference of 0.060%), and English (5.2%, a difference of 0.070%).
| Demographics | Rating | Rank | Unemployment Among Ages 65 to 74 years |
| Immigrants | Sudan | 98.9 /100 | #77 | Exceptional 5.2% |
| Northern Europeans | 98.9 /100 | #78 | Exceptional 5.2% |
| Slavs | 98.7 /100 | #79 | Exceptional 5.2% |
| Immigrants | South Africa | 98.6 /100 | #80 | Exceptional 5.2% |
| Immigrants | Scotland | 98.6 /100 | #81 | Exceptional 5.2% |
| Thais | 98.6 /100 | #82 | Exceptional 5.2% |
| Immigrants | Middle Africa | 98.4 /100 | #83 | Exceptional 5.2% |
| Immigrants | Hungary | 98.0 /100 | #84 | Exceptional 5.2% |
| British | 97.9 /100 | #85 | Exceptional 5.2% |
| Danes | 97.9 /100 | #86 | Exceptional 5.2% |
| Scottish | 97.9 /100 | #87 | Exceptional 5.2% |
| Immigrants | Saudi Arabia | 97.9 /100 | #88 | Exceptional 5.2% |
| English | 97.8 /100 | #89 | Exceptional 5.2% |
| Luxembourgers | 97.6 /100 | #90 | Exceptional 5.2% |
| Romanians | 97.4 /100 | #91 | Exceptional 5.2% |