Immigrants from Afghanistan vs Immigrants from China Unemployment Among Seniors over 65 years
COMPARE
Immigrants from Afghanistan
Immigrants from China
Unemployment Among Seniors over 65 years
Unemployment Among Seniors over 65 years Comparison
Immigrants from Afghanistan
Immigrants from China
5.1%
UNEMPLOYMENT AMONG SENIORS OVER 65 YEARS
76.8/ 100
METRIC RATING
149th/ 347
METRIC RANK
5.2%
UNEMPLOYMENT AMONG SENIORS OVER 65 YEARS
16.9/ 100
METRIC RATING
204th/ 347
METRIC RANK
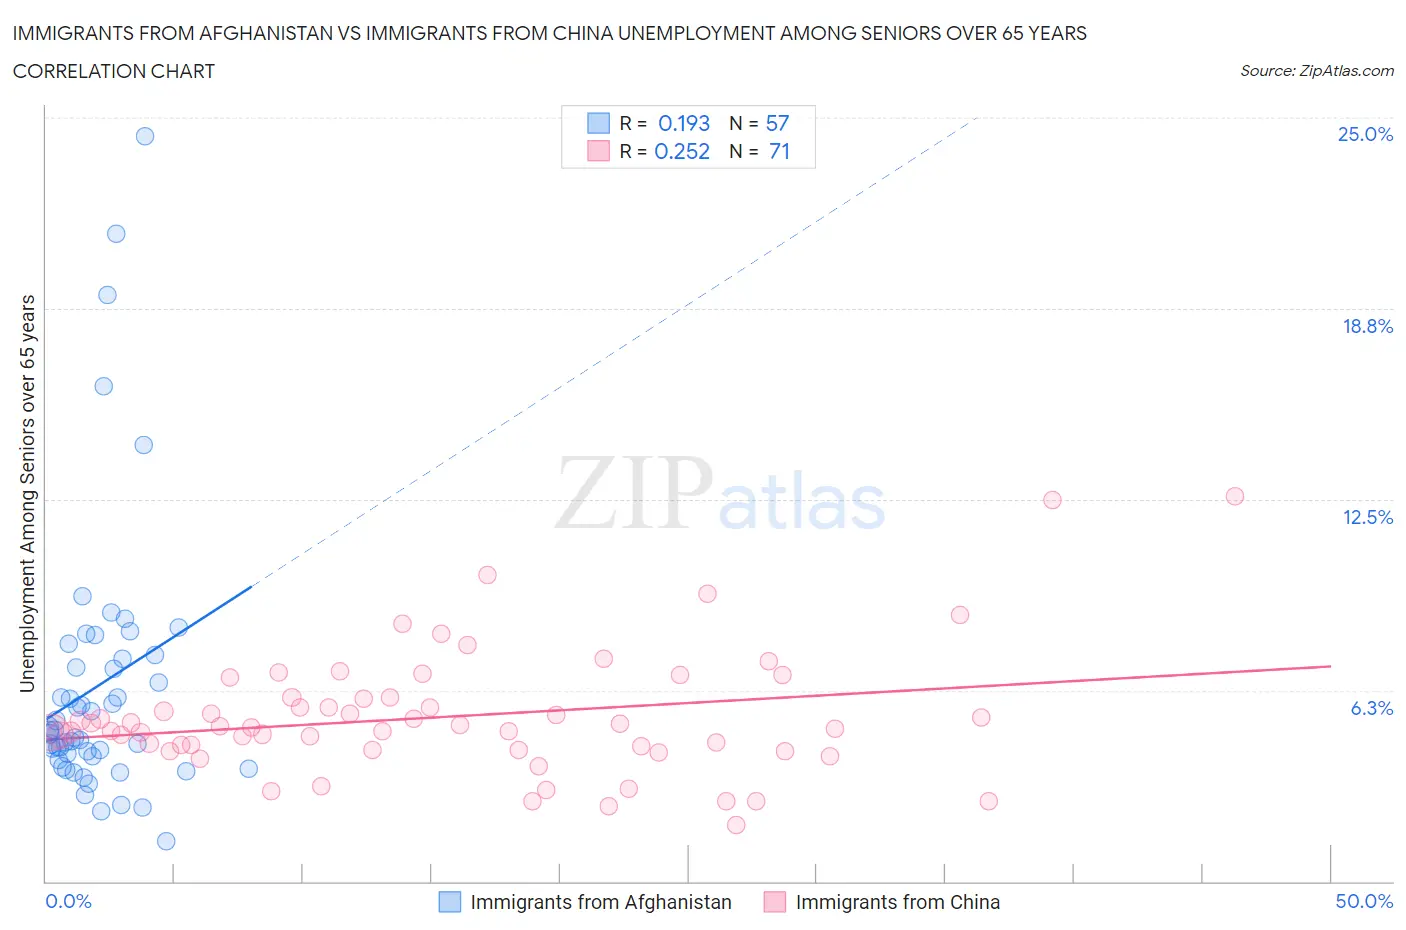
Immigrants from Afghanistan vs Immigrants from China Unemployment Among Seniors over 65 years Correlation Chart
The statistical analysis conducted on geographies consisting of 142,603,246 people shows a poor positive correlation between the proportion of Immigrants from Afghanistan and unemployment rate amomg seniors over the age of 65 in the United States with a correlation coefficient (R) of 0.193 and weighted average of 5.1%. Similarly, the statistical analysis conducted on geographies consisting of 404,398,266 people shows a weak positive correlation between the proportion of Immigrants from China and unemployment rate amomg seniors over the age of 65 in the United States with a correlation coefficient (R) of 0.252 and weighted average of 5.2%, a difference of 2.2%.
Unemployment Among Seniors over 65 years Correlation Summary
| Measurement | Immigrants from Afghanistan | Immigrants from China |
| Minimum | 1.3% | 1.8% |
| Maximum | 24.4% | 12.6% |
| Range | 23.1% | 10.8% |
| Mean | 6.4% | 5.4% |
| Median | 4.9% | 5.0% |
| Interquartile 25% (IQ1) | 4.0% | 4.3% |
| Interquartile 75% (IQ3) | 7.3% | 6.0% |
| Interquartile Range (IQR) | 3.3% | 1.7% |
| Standard Deviation (Sample) | 4.5% | 2.0% |
| Standard Deviation (Population) | 4.4% | 2.0% |
Similar Demographics by Unemployment Among Seniors over 65 years
Demographics Similar to Immigrants from Afghanistan by Unemployment Among Seniors over 65 years
In terms of unemployment among seniors over 65 years, the demographic groups most similar to Immigrants from Afghanistan are Greek (5.1%, a difference of 0.010%), Slovak (5.1%, a difference of 0.050%), Immigrants from Asia (5.1%, a difference of 0.050%), Pakistani (5.1%, a difference of 0.060%), and Immigrants from Russia (5.1%, a difference of 0.080%).
| Demographics | Rating | Rank | Unemployment Among Seniors over 65 years |
| Immigrants | Indonesia | 81.0 /100 | #142 | Excellent 5.1% |
| Senegalese | 80.4 /100 | #143 | Excellent 5.1% |
| Poles | 80.3 /100 | #144 | Excellent 5.1% |
| Spanish | 78.8 /100 | #145 | Good 5.1% |
| Immigrants | Russia | 78.5 /100 | #146 | Good 5.1% |
| Slovaks | 77.9 /100 | #147 | Good 5.1% |
| Greeks | 77.0 /100 | #148 | Good 5.1% |
| Immigrants | Afghanistan | 76.8 /100 | #149 | Good 5.1% |
| Immigrants | Asia | 75.6 /100 | #150 | Good 5.1% |
| Pakistanis | 75.5 /100 | #151 | Good 5.1% |
| Canadians | 74.7 /100 | #152 | Good 5.1% |
| Immigrants | Czechoslovakia | 74.5 /100 | #153 | Good 5.1% |
| Immigrants | Hong Kong | 74.0 /100 | #154 | Good 5.1% |
| Basques | 72.9 /100 | #155 | Good 5.1% |
| Immigrants | Romania | 72.4 /100 | #156 | Good 5.1% |
Demographics Similar to Immigrants from China by Unemployment Among Seniors over 65 years
In terms of unemployment among seniors over 65 years, the demographic groups most similar to Immigrants from China are Subsaharan African (5.2%, a difference of 0.010%), Immigrants from Northern Africa (5.2%, a difference of 0.040%), Laotian (5.2%, a difference of 0.060%), Immigrants from Pakistan (5.2%, a difference of 0.080%), and South American Indian (5.2%, a difference of 0.10%).
| Demographics | Rating | Rank | Unemployment Among Seniors over 65 years |
| Guamanians/Chamorros | 22.5 /100 | #197 | Fair 5.2% |
| Maltese | 19.6 /100 | #198 | Poor 5.2% |
| Immigrants | Europe | 19.0 /100 | #199 | Poor 5.2% |
| Immigrants | Pakistan | 18.4 /100 | #200 | Poor 5.2% |
| Laotians | 18.1 /100 | #201 | Poor 5.2% |
| Immigrants | Northern Africa | 17.7 /100 | #202 | Poor 5.2% |
| Sub-Saharan Africans | 17.1 /100 | #203 | Poor 5.2% |
| Immigrants | China | 16.9 /100 | #204 | Poor 5.2% |
| South American Indians | 15.3 /100 | #205 | Poor 5.2% |
| German Russians | 14.7 /100 | #206 | Poor 5.2% |
| Immigrants | Philippines | 13.2 /100 | #207 | Poor 5.2% |
| Uruguayans | 12.6 /100 | #208 | Poor 5.2% |
| Alsatians | 11.4 /100 | #209 | Poor 5.2% |
| Immigrants | Uzbekistan | 10.7 /100 | #210 | Poor 5.2% |
| Africans | 10.4 /100 | #211 | Poor 5.2% |