Hungarian vs Immigrants from Fiji Unemployment Among Youth under 25 years
COMPARE
Hungarian
Immigrants from Fiji
Unemployment Among Youth under 25 years
Unemployment Among Youth under 25 years Comparison
Hungarians
Immigrants from Fiji
11.4%
UNEMPLOYMENT AMONG YOUTH UNDER 25 YEARS
85.7/ 100
METRIC RATING
130th/ 347
METRIC RANK
12.1%
UNEMPLOYMENT AMONG YOUTH UNDER 25 YEARS
2.1/ 100
METRIC RATING
228th/ 347
METRIC RANK
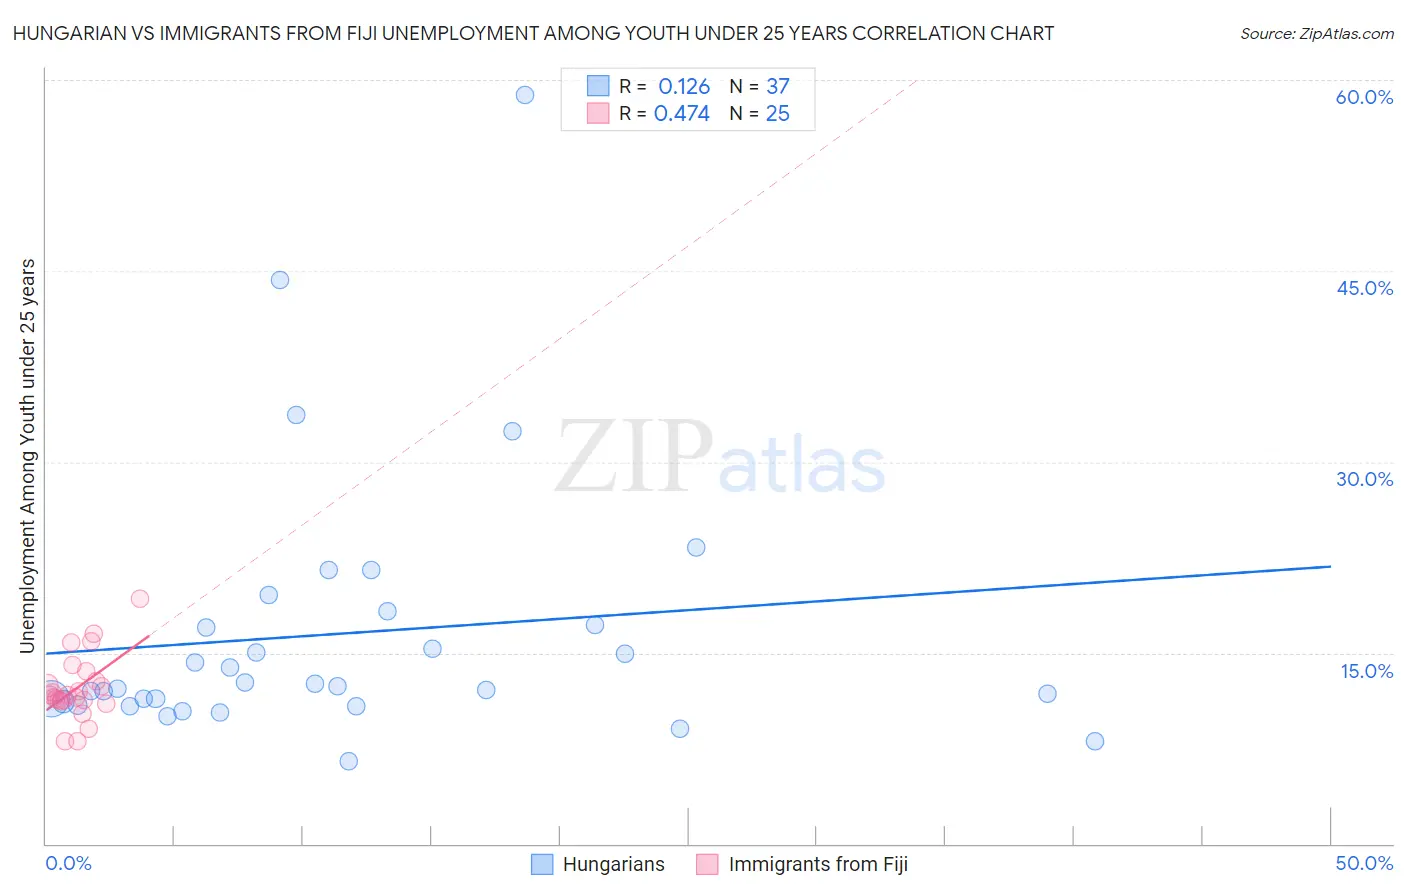
Hungarian vs Immigrants from Fiji Unemployment Among Youth under 25 years Correlation Chart
The statistical analysis conducted on geographies consisting of 474,257,307 people shows a poor positive correlation between the proportion of Hungarians and unemployment rate among youth under the age of 25 in the United States with a correlation coefficient (R) of 0.126 and weighted average of 11.4%. Similarly, the statistical analysis conducted on geographies consisting of 93,619,891 people shows a moderate positive correlation between the proportion of Immigrants from Fiji and unemployment rate among youth under the age of 25 in the United States with a correlation coefficient (R) of 0.474 and weighted average of 12.1%, a difference of 5.9%.
Unemployment Among Youth under 25 years Correlation Summary
| Measurement | Hungarian | Immigrants from Fiji |
| Minimum | 6.4% | 8.1% |
| Maximum | 58.8% | 19.2% |
| Range | 52.4% | 11.2% |
| Mean | 16.5% | 12.2% |
| Median | 12.4% | 11.7% |
| Interquartile 25% (IQ1) | 11.0% | 11.2% |
| Interquartile 75% (IQ3) | 17.7% | 13.2% |
| Interquartile Range (IQR) | 6.7% | 2.0% |
| Standard Deviation (Sample) | 10.5% | 2.5% |
| Standard Deviation (Population) | 10.3% | 2.5% |
Similar Demographics by Unemployment Among Youth under 25 years
Demographics Similar to Hungarians by Unemployment Among Youth under 25 years
In terms of unemployment among youth under 25 years, the demographic groups most similar to Hungarians are Turkish (11.4%, a difference of 0.010%), Immigrants from Hungary (11.4%, a difference of 0.030%), Greek (11.4%, a difference of 0.050%), Canadian (11.4%, a difference of 0.080%), and Immigrants from Spain (11.4%, a difference of 0.090%).
| Demographics | Rating | Rank | Unemployment Among Youth under 25 years |
| Basques | 87.8 /100 | #123 | Excellent 11.4% |
| Italians | 87.2 /100 | #124 | Excellent 11.4% |
| Immigrants | Argentina | 87.2 /100 | #125 | Excellent 11.4% |
| Canadians | 86.6 /100 | #126 | Excellent 11.4% |
| Greeks | 86.2 /100 | #127 | Excellent 11.4% |
| Immigrants | Hungary | 86.0 /100 | #128 | Excellent 11.4% |
| Turks | 85.8 /100 | #129 | Excellent 11.4% |
| Hungarians | 85.7 /100 | #130 | Excellent 11.4% |
| Immigrants | Spain | 84.6 /100 | #131 | Excellent 11.4% |
| Ethiopians | 83.2 /100 | #132 | Excellent 11.4% |
| Lebanese | 83.1 /100 | #133 | Excellent 11.4% |
| Immigrants | Chile | 80.4 /100 | #134 | Excellent 11.4% |
| Immigrants | Oceania | 80.2 /100 | #135 | Excellent 11.4% |
| Romanians | 80.1 /100 | #136 | Excellent 11.4% |
| Asians | 79.7 /100 | #137 | Good 11.4% |
Demographics Similar to Immigrants from Fiji by Unemployment Among Youth under 25 years
In terms of unemployment among youth under 25 years, the demographic groups most similar to Immigrants from Fiji are Moroccan (12.1%, a difference of 0.010%), Choctaw (12.1%, a difference of 0.060%), Immigrants from South America (12.1%, a difference of 0.16%), Immigrants from Iran (12.0%, a difference of 0.23%), and Immigrants from Belarus (12.1%, a difference of 0.23%).
| Demographics | Rating | Rank | Unemployment Among Youth under 25 years |
| Immigrants | Portugal | 4.9 /100 | #221 | Tragic 12.0% |
| Israelis | 4.1 /100 | #222 | Tragic 12.0% |
| Immigrants | Ireland | 3.5 /100 | #223 | Tragic 12.0% |
| Hawaiians | 3.5 /100 | #224 | Tragic 12.0% |
| Immigrants | Ukraine | 3.0 /100 | #225 | Tragic 12.0% |
| Immigrants | Israel | 2.6 /100 | #226 | Tragic 12.0% |
| Immigrants | Iran | 2.6 /100 | #227 | Tragic 12.0% |
| Immigrants | Fiji | 2.1 /100 | #228 | Tragic 12.1% |
| Moroccans | 2.1 /100 | #229 | Tragic 12.1% |
| Choctaw | 1.9 /100 | #230 | Tragic 12.1% |
| Immigrants | South America | 1.8 /100 | #231 | Tragic 12.1% |
| Immigrants | Belarus | 1.6 /100 | #232 | Tragic 12.1% |
| South American Indians | 1.6 /100 | #233 | Tragic 12.1% |
| Guatemalans | 1.4 /100 | #234 | Tragic 12.1% |
| Immigrants | Guatemala | 1.4 /100 | #235 | Tragic 12.1% |