Houma vs Immigrants from Nicaragua Unemployment Among Ages 25 to 29 years
COMPARE
Houma
Immigrants from Nicaragua
Unemployment Among Ages 25 to 29 years
Unemployment Among Ages 25 to 29 years Comparison
Houma
Immigrants from Nicaragua
8.7%
UNEMPLOYMENT AMONG AGES 25 TO 29 YEARS
0.0/ 100
METRIC RATING
324th/ 347
METRIC RANK
6.4%
UNEMPLOYMENT AMONG AGES 25 TO 29 YEARS
87.5/ 100
METRIC RATING
112th/ 347
METRIC RANK
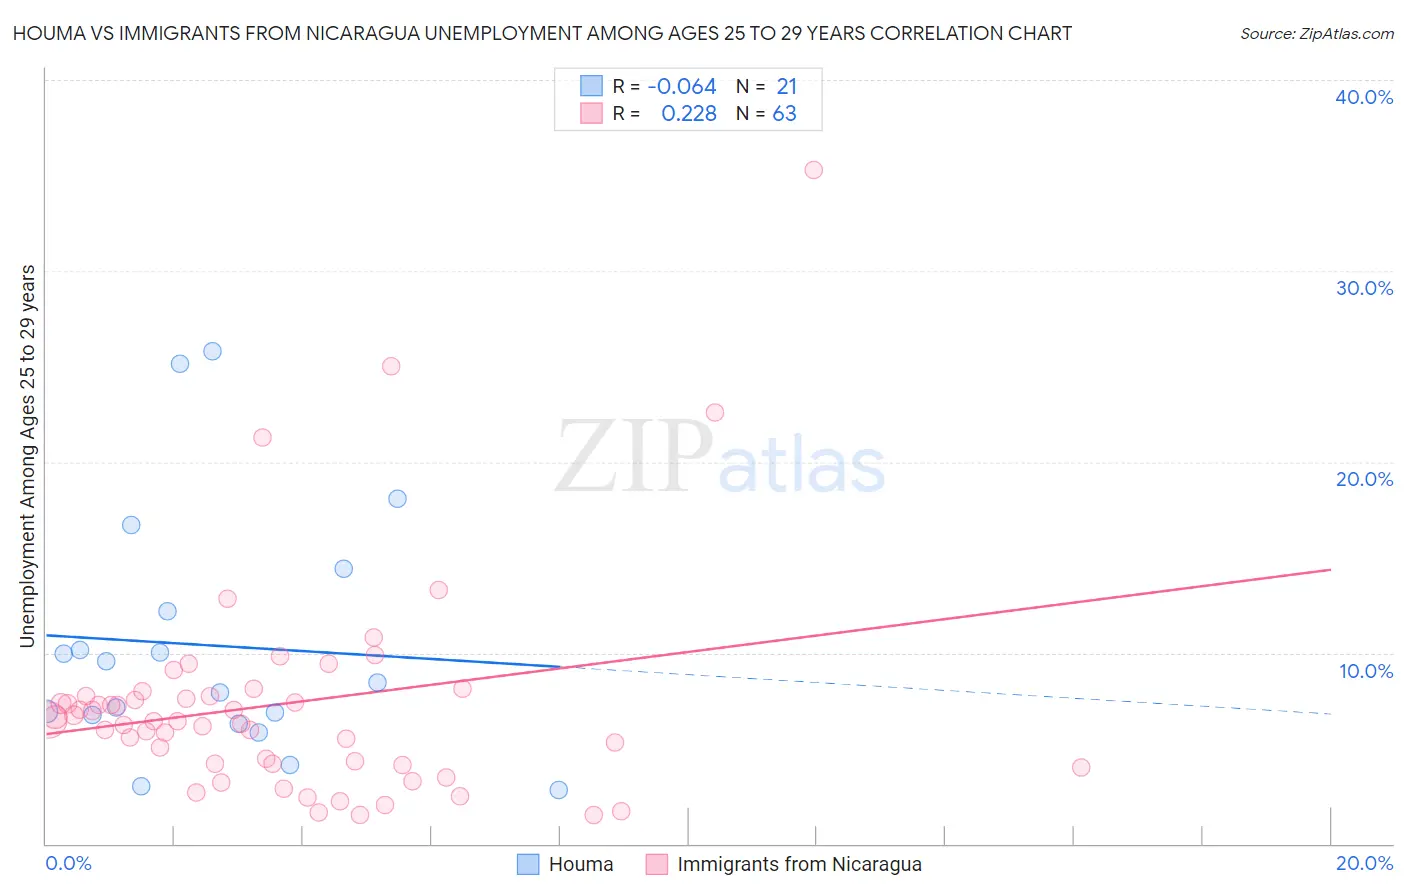
Houma vs Immigrants from Nicaragua Unemployment Among Ages 25 to 29 years Correlation Chart
The statistical analysis conducted on geographies consisting of 36,263,529 people shows a slight negative correlation between the proportion of Houma and unemployment rate among population between the ages 25 and 29 in the United States with a correlation coefficient (R) of -0.064 and weighted average of 8.7%. Similarly, the statistical analysis conducted on geographies consisting of 231,259,167 people shows a weak positive correlation between the proportion of Immigrants from Nicaragua and unemployment rate among population between the ages 25 and 29 in the United States with a correlation coefficient (R) of 0.228 and weighted average of 6.4%, a difference of 35.2%.
Unemployment Among Ages 25 to 29 years Correlation Summary
| Measurement | Houma | Immigrants from Nicaragua |
| Minimum | 2.8% | 1.5% |
| Maximum | 25.8% | 35.3% |
| Range | 23.0% | 33.8% |
| Mean | 10.4% | 7.3% |
| Median | 8.5% | 6.4% |
| Interquartile 25% (IQ1) | 6.5% | 4.2% |
| Interquartile 75% (IQ3) | 13.3% | 7.7% |
| Interquartile Range (IQR) | 6.8% | 3.6% |
| Standard Deviation (Sample) | 6.4% | 5.7% |
| Standard Deviation (Population) | 6.3% | 5.7% |
Similar Demographics by Unemployment Among Ages 25 to 29 years
Demographics Similar to Houma by Unemployment Among Ages 25 to 29 years
In terms of unemployment among ages 25 to 29 years, the demographic groups most similar to Houma are Dominican (8.7%, a difference of 0.36%), Tlingit-Haida (8.7%, a difference of 0.45%), Yakama (8.8%, a difference of 0.51%), Immigrants from Dominican Republic (8.6%, a difference of 1.2%), and Black/African American (8.6%, a difference of 1.9%).
| Demographics | Rating | Rank | Unemployment Among Ages 25 to 29 years |
| Immigrants | Guyana | 0.0 /100 | #317 | Tragic 8.5% |
| Guyanese | 0.0 /100 | #318 | Tragic 8.5% |
| Immigrants | Armenia | 0.0 /100 | #319 | Tragic 8.5% |
| Blacks/African Americans | 0.0 /100 | #320 | Tragic 8.6% |
| Immigrants | Dominican Republic | 0.0 /100 | #321 | Tragic 8.6% |
| Tlingit-Haida | 0.0 /100 | #322 | Tragic 8.7% |
| Dominicans | 0.0 /100 | #323 | Tragic 8.7% |
| Houma | 0.0 /100 | #324 | Tragic 8.7% |
| Yakama | 0.0 /100 | #325 | Tragic 8.8% |
| Shoshone | 0.0 /100 | #326 | Tragic 9.2% |
| Colville | 0.0 /100 | #327 | Tragic 9.2% |
| Apache | 0.0 /100 | #328 | Tragic 9.5% |
| Aleuts | 0.0 /100 | #329 | Tragic 9.7% |
| Natives/Alaskans | 0.0 /100 | #330 | Tragic 9.8% |
| Alaska Natives | 0.0 /100 | #331 | Tragic 10.2% |
Demographics Similar to Immigrants from Nicaragua by Unemployment Among Ages 25 to 29 years
In terms of unemployment among ages 25 to 29 years, the demographic groups most similar to Immigrants from Nicaragua are Immigrants from Colombia (6.4%, a difference of 0.020%), Immigrants from Egypt (6.5%, a difference of 0.050%), European (6.4%, a difference of 0.060%), Immigrants from Albania (6.4%, a difference of 0.070%), and Croatian (6.4%, a difference of 0.11%).
| Demographics | Rating | Rank | Unemployment Among Ages 25 to 29 years |
| Immigrants | Kazakhstan | 89.8 /100 | #105 | Excellent 6.4% |
| Immigrants | Hungary | 89.4 /100 | #106 | Excellent 6.4% |
| Swiss | 88.6 /100 | #107 | Excellent 6.4% |
| Croatians | 88.2 /100 | #108 | Excellent 6.4% |
| Immigrants | Albania | 87.9 /100 | #109 | Excellent 6.4% |
| Europeans | 87.8 /100 | #110 | Excellent 6.4% |
| Immigrants | Colombia | 87.6 /100 | #111 | Excellent 6.4% |
| Immigrants | Nicaragua | 87.5 /100 | #112 | Excellent 6.4% |
| Immigrants | Egypt | 87.1 /100 | #113 | Excellent 6.5% |
| Germans | 86.3 /100 | #114 | Excellent 6.5% |
| Macedonians | 86.1 /100 | #115 | Excellent 6.5% |
| Pakistanis | 85.9 /100 | #116 | Excellent 6.5% |
| Immigrants | Uruguay | 85.7 /100 | #117 | Excellent 6.5% |
| Chileans | 85.3 /100 | #118 | Excellent 6.5% |
| Immigrants | South Africa | 84.9 /100 | #119 | Excellent 6.5% |