Hopi vs Yup'ik Unemployment Among Seniors over 65 years
COMPARE
Hopi
Yup'ik
Unemployment Among Seniors over 65 years
Unemployment Among Seniors over 65 years Comparison
Hopi
Yup'ik
5.3%
UNEMPLOYMENT AMONG SENIORS OVER 65 YEARS
3.5/ 100
METRIC RATING
232nd/ 347
METRIC RANK
9.1%
UNEMPLOYMENT AMONG SENIORS OVER 65 YEARS
0.0/ 100
METRIC RATING
346th/ 347
METRIC RANK
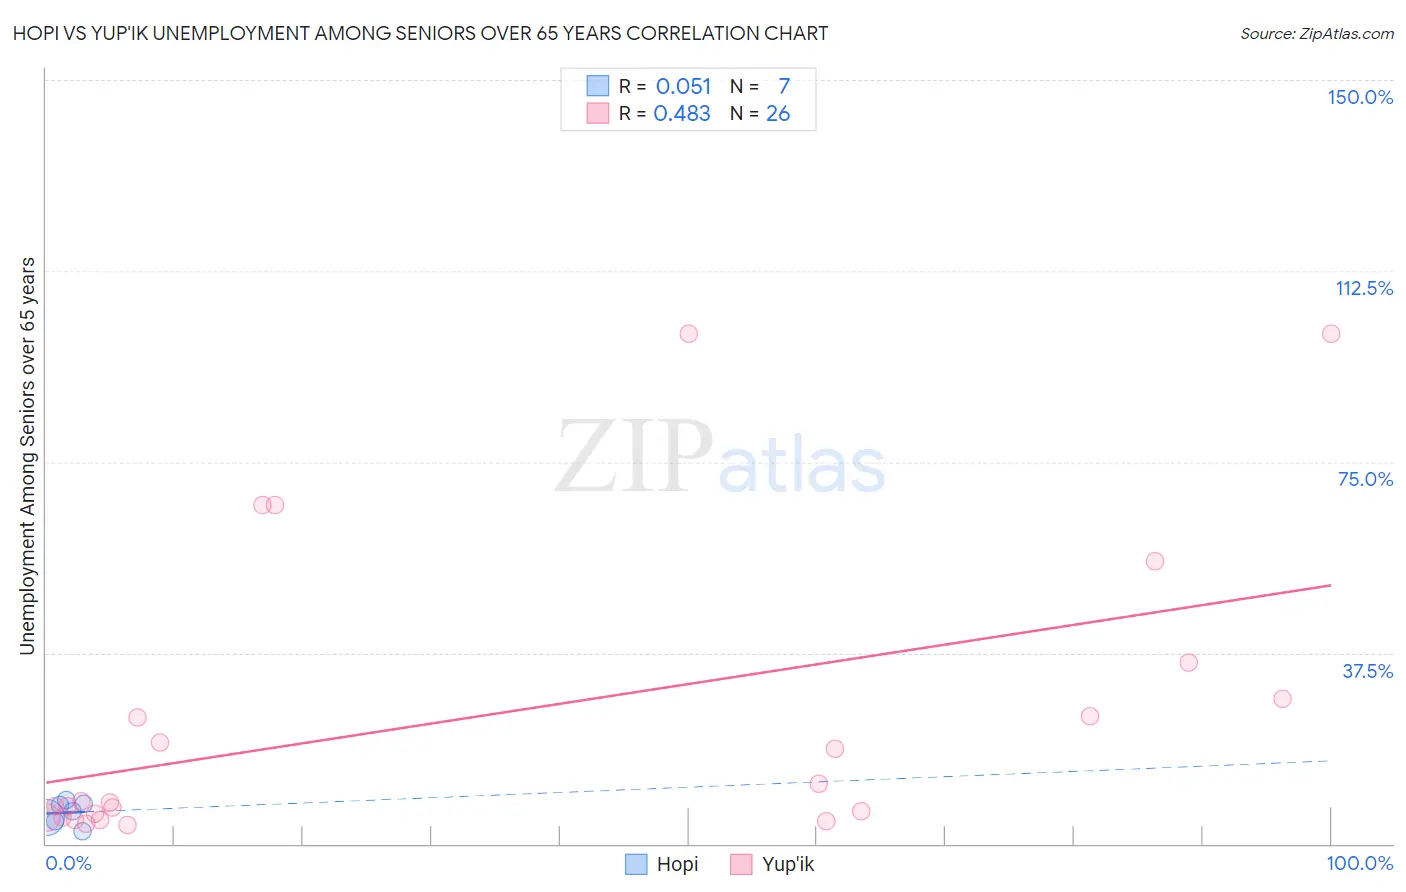
Hopi vs Yup'ik Unemployment Among Seniors over 65 years Correlation Chart
The statistical analysis conducted on geographies consisting of 72,051,178 people shows a slight positive correlation between the proportion of Hopi and unemployment rate amomg seniors over the age of 65 in the United States with a correlation coefficient (R) of 0.051 and weighted average of 5.3%. Similarly, the statistical analysis conducted on geographies consisting of 38,448,433 people shows a moderate positive correlation between the proportion of Yup'ik and unemployment rate amomg seniors over the age of 65 in the United States with a correlation coefficient (R) of 0.483 and weighted average of 9.1%, a difference of 72.9%.
Unemployment Among Seniors over 65 years Correlation Summary
| Measurement | Hopi | Yup'ik |
| Minimum | 2.6% | 3.6% |
| Maximum | 8.6% | 100.1% |
| Range | 6.1% | 96.5% |
| Mean | 6.1% | 24.4% |
| Median | 6.5% | 8.2% |
| Interquartile 25% (IQ1) | 4.4% | 5.0% |
| Interquartile 75% (IQ3) | 7.9% | 28.5% |
| Interquartile Range (IQR) | 3.5% | 23.5% |
| Standard Deviation (Sample) | 2.2% | 29.1% |
| Standard Deviation (Population) | 2.0% | 28.5% |
Similar Demographics by Unemployment Among Seniors over 65 years
Demographics Similar to Hopi by Unemployment Among Seniors over 65 years
In terms of unemployment among seniors over 65 years, the demographic groups most similar to Hopi are Hungarian (5.3%, a difference of 0.080%), Marshallese (5.3%, a difference of 0.090%), Blackfeet (5.3%, a difference of 0.090%), Immigrants from Argentina (5.3%, a difference of 0.11%), and Samoan (5.3%, a difference of 0.15%).
| Demographics | Rating | Rank | Unemployment Among Seniors over 65 years |
| Hondurans | 5.6 /100 | #225 | Tragic 5.3% |
| Immigrants | Croatia | 5.3 /100 | #226 | Tragic 5.3% |
| French American Indians | 5.2 /100 | #227 | Tragic 5.3% |
| Haitians | 4.4 /100 | #228 | Tragic 5.3% |
| Samoans | 4.2 /100 | #229 | Tragic 5.3% |
| Immigrants | Argentina | 4.0 /100 | #230 | Tragic 5.3% |
| Hungarians | 3.9 /100 | #231 | Tragic 5.3% |
| Hopi | 3.5 /100 | #232 | Tragic 5.3% |
| Marshallese | 3.1 /100 | #233 | Tragic 5.3% |
| Blackfeet | 3.1 /100 | #234 | Tragic 5.3% |
| Immigrants | Albania | 2.7 /100 | #235 | Tragic 5.3% |
| Immigrants | Costa Rica | 2.1 /100 | #236 | Tragic 5.3% |
| Immigrants | Greece | 2.0 /100 | #237 | Tragic 5.3% |
| Immigrants | Israel | 2.0 /100 | #238 | Tragic 5.3% |
| Immigrants | Senegal | 1.8 /100 | #239 | Tragic 5.3% |
Demographics Similar to Yup'ik by Unemployment Among Seniors over 65 years
In terms of unemployment among seniors over 65 years, the demographic groups most similar to Yup'ik are Immigrants from Yemen (8.2%, a difference of 11.4%), Alaskan Athabascan (7.0%, a difference of 29.6%), Tlingit-Haida (6.8%, a difference of 34.5%), Navajo (6.7%, a difference of 36.3%), and Yakama (6.7%, a difference of 36.9%).
| Demographics | Rating | Rank | Unemployment Among Seniors over 65 years |
| Immigrants | Dominican Republic | 0.0 /100 | #333 | Tragic 6.0% |
| Tohono O'odham | 0.0 /100 | #334 | Tragic 6.1% |
| Immigrants | Armenia | 0.0 /100 | #335 | Tragic 6.2% |
| Pima | 0.0 /100 | #336 | Tragic 6.3% |
| Alaska Natives | 0.0 /100 | #337 | Tragic 6.3% |
| Immigrants | Azores | 0.0 /100 | #338 | Tragic 6.3% |
| Paiute | 0.0 /100 | #339 | Tragic 6.3% |
| Ute | 0.0 /100 | #340 | Tragic 6.3% |
| Yakama | 0.0 /100 | #341 | Tragic 6.7% |
| Navajo | 0.0 /100 | #342 | Tragic 6.7% |
| Tlingit-Haida | 0.0 /100 | #343 | Tragic 6.8% |
| Alaskan Athabascans | 0.0 /100 | #344 | Tragic 7.0% |
| Immigrants | Yemen | 0.0 /100 | #345 | Tragic 8.2% |
| Yup'ik | 0.0 /100 | #346 | Tragic 9.1% |
| Crow | 0.0 /100 | #347 | Tragic 16.9% |