Hopi vs Immigrants from France Unemployment Among Ages 45 to 54 years
COMPARE
Hopi
Immigrants from France
Unemployment Among Ages 45 to 54 years
Unemployment Among Ages 45 to 54 years Comparison
Hopi
Immigrants from France
7.5%
UNEMPLOYMENT AMONG AGES 45 TO 54 YEARS
0.0/ 100
METRIC RATING
340th/ 347
METRIC RANK
4.5%
UNEMPLOYMENT AMONG AGES 45 TO 54 YEARS
49.4/ 100
METRIC RATING
175th/ 347
METRIC RANK
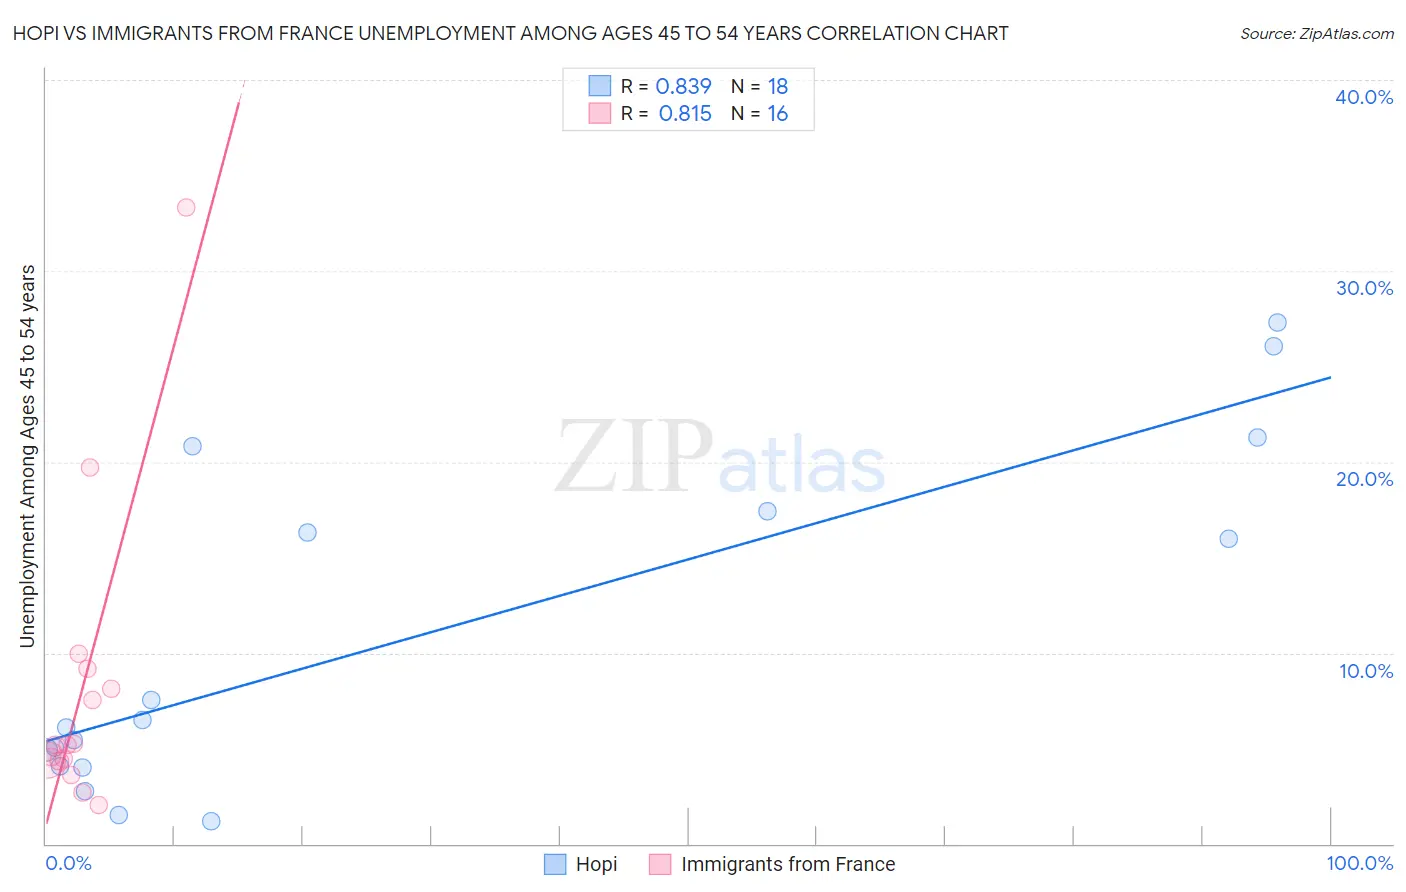
Hopi vs Immigrants from France Unemployment Among Ages 45 to 54 years Correlation Chart
The statistical analysis conducted on geographies consisting of 74,415,108 people shows a very strong positive correlation between the proportion of Hopi and unemployment rate among population between the ages 45 and 54 in the United States with a correlation coefficient (R) of 0.839 and weighted average of 7.5%. Similarly, the statistical analysis conducted on geographies consisting of 283,320,453 people shows a very strong positive correlation between the proportion of Immigrants from France and unemployment rate among population between the ages 45 and 54 in the United States with a correlation coefficient (R) of 0.815 and weighted average of 4.5%, a difference of 66.2%.
Unemployment Among Ages 45 to 54 years Correlation Summary
| Measurement | Hopi | Immigrants from France |
| Minimum | 1.2% | 2.0% |
| Maximum | 27.3% | 33.3% |
| Range | 26.1% | 31.3% |
| Mean | 10.8% | 8.1% |
| Median | 6.3% | 5.2% |
| Interquartile 25% (IQ1) | 4.0% | 4.4% |
| Interquartile 75% (IQ3) | 17.4% | 8.6% |
| Interquartile Range (IQR) | 13.4% | 4.3% |
| Standard Deviation (Sample) | 8.7% | 7.9% |
| Standard Deviation (Population) | 8.5% | 7.7% |
Similar Demographics by Unemployment Among Ages 45 to 54 years
Demographics Similar to Hopi by Unemployment Among Ages 45 to 54 years
In terms of unemployment among ages 45 to 54 years, the demographic groups most similar to Hopi are Arapaho (7.5%, a difference of 0.46%), Colville (7.4%, a difference of 1.9%), Paiute (7.8%, a difference of 3.5%), Apache (7.0%, a difference of 7.0%), and Puerto Rican (6.8%, a difference of 10.6%).
| Demographics | Rating | Rank | Unemployment Among Ages 45 to 54 years |
| Immigrants | Yemen | 0.0 /100 | #333 | Tragic 6.5% |
| Sioux | 0.0 /100 | #334 | Tragic 6.6% |
| Navajo | 0.0 /100 | #335 | Tragic 6.7% |
| Puerto Ricans | 0.0 /100 | #336 | Tragic 6.8% |
| Apache | 0.0 /100 | #337 | Tragic 7.0% |
| Colville | 0.0 /100 | #338 | Tragic 7.4% |
| Arapaho | 0.0 /100 | #339 | Tragic 7.5% |
| Hopi | 0.0 /100 | #340 | Tragic 7.5% |
| Paiute | 0.0 /100 | #341 | Tragic 7.8% |
| Alaskan Athabascans | 0.0 /100 | #342 | Tragic 8.5% |
| Inupiat | 0.0 /100 | #343 | Tragic 9.2% |
| Yuman | 0.0 /100 | #344 | Tragic 9.5% |
| Cheyenne | 0.0 /100 | #345 | Tragic 10.6% |
| Yup'ik | 0.0 /100 | #346 | Tragic 11.9% |
| Crow | 0.0 /100 | #347 | Tragic 13.7% |
Demographics Similar to Immigrants from France by Unemployment Among Ages 45 to 54 years
In terms of unemployment among ages 45 to 54 years, the demographic groups most similar to Immigrants from France are Puget Sound Salish (4.5%, a difference of 0.020%), Immigrants from Northern Africa (4.5%, a difference of 0.020%), Immigrants from Hungary (4.5%, a difference of 0.030%), Immigrants from Australia (4.5%, a difference of 0.040%), and Immigrants from Russia (4.5%, a difference of 0.060%).
| Demographics | Rating | Rank | Unemployment Among Ages 45 to 54 years |
| Immigrants | Europe | 54.7 /100 | #168 | Average 4.5% |
| Immigrants | Egypt | 54.7 /100 | #169 | Average 4.5% |
| Spaniards | 54.3 /100 | #170 | Average 4.5% |
| Egyptians | 53.6 /100 | #171 | Average 4.5% |
| Colombians | 53.3 /100 | #172 | Average 4.5% |
| Immigrants | Colombia | 52.0 /100 | #173 | Average 4.5% |
| Immigrants | Hungary | 50.0 /100 | #174 | Average 4.5% |
| Immigrants | France | 49.4 /100 | #175 | Average 4.5% |
| Puget Sound Salish | 49.1 /100 | #176 | Average 4.5% |
| Immigrants | Northern Africa | 49.0 /100 | #177 | Average 4.5% |
| Immigrants | Australia | 48.5 /100 | #178 | Average 4.5% |
| Immigrants | Russia | 48.2 /100 | #179 | Average 4.5% |
| Malaysians | 47.5 /100 | #180 | Average 4.5% |
| Immigrants | Poland | 47.0 /100 | #181 | Average 4.5% |
| Immigrants | China | 46.7 /100 | #182 | Average 4.5% |