Hopi vs Immigrants from Czechoslovakia Unemployment Among Women with Children Under 18 years
COMPARE
Hopi
Immigrants from Czechoslovakia
Unemployment Among Women with Children Under 18 years
Unemployment Among Women with Children Under 18 years Comparison
Hopi
Immigrants from Czechoslovakia
7.4%
UNEMPLOYMENT AMONG WOMEN WITH CHILDREN UNDER 18 YEARS
0.0/ 100
METRIC RATING
331st/ 347
METRIC RANK
5.2%
UNEMPLOYMENT AMONG WOMEN WITH CHILDREN UNDER 18 YEARS
88.9/ 100
METRIC RATING
110th/ 347
METRIC RANK
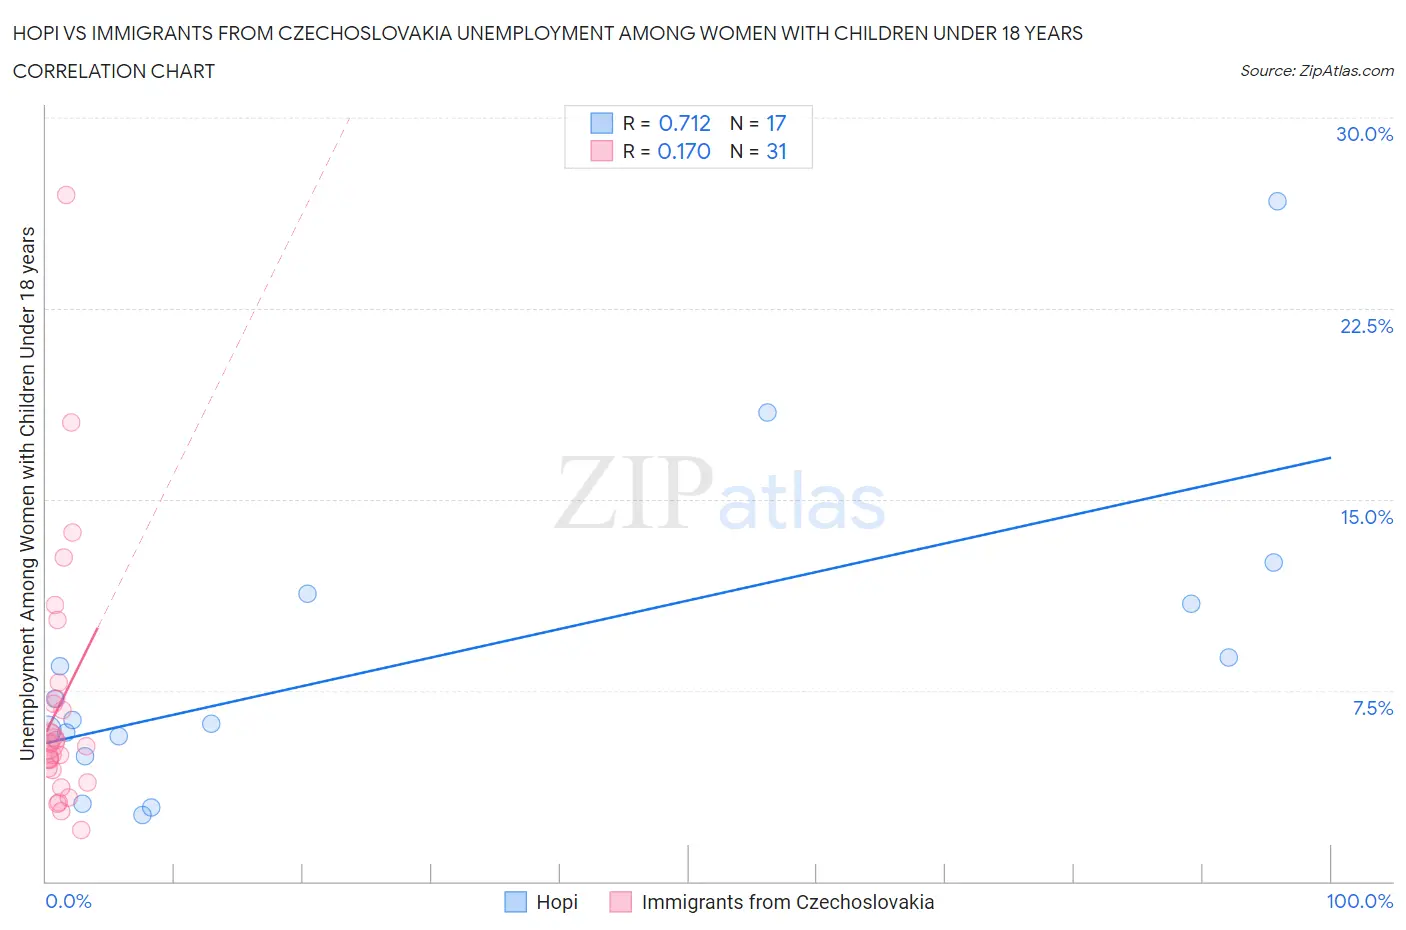
Hopi vs Immigrants from Czechoslovakia Unemployment Among Women with Children Under 18 years Correlation Chart
The statistical analysis conducted on geographies consisting of 73,832,952 people shows a strong positive correlation between the proportion of Hopi and unemployment rate among women with children under the age of 18 in the United States with a correlation coefficient (R) of 0.712 and weighted average of 7.4%. Similarly, the statistical analysis conducted on geographies consisting of 191,047,665 people shows a poor positive correlation between the proportion of Immigrants from Czechoslovakia and unemployment rate among women with children under the age of 18 in the United States with a correlation coefficient (R) of 0.170 and weighted average of 5.2%, a difference of 41.6%.
Unemployment Among Women with Children Under 18 years Correlation Summary
| Measurement | Hopi | Immigrants from Czechoslovakia |
| Minimum | 2.6% | 2.0% |
| Maximum | 26.7% | 27.0% |
| Range | 24.1% | 25.0% |
| Mean | 8.7% | 6.9% |
| Median | 6.3% | 5.4% |
| Interquartile 25% (IQ1) | 5.3% | 4.4% |
| Interquartile 75% (IQ3) | 11.1% | 7.2% |
| Interquartile Range (IQR) | 5.8% | 2.8% |
| Standard Deviation (Sample) | 6.1% | 5.1% |
| Standard Deviation (Population) | 5.9% | 5.0% |
Similar Demographics by Unemployment Among Women with Children Under 18 years
Demographics Similar to Hopi by Unemployment Among Women with Children Under 18 years
In terms of unemployment among women with children under 18 years, the demographic groups most similar to Hopi are Dominican (7.5%, a difference of 0.54%), Colville (7.4%, a difference of 0.56%), Immigrants from Dominican Republic (7.5%, a difference of 0.90%), Black/African American (7.3%, a difference of 2.0%), and Native/Alaskan (7.2%, a difference of 2.4%).
| Demographics | Rating | Rank | Unemployment Among Women with Children Under 18 years |
| Paiute | 0.0 /100 | #324 | Tragic 6.9% |
| Immigrants | Dominica | 0.0 /100 | #325 | Tragic 7.0% |
| Chippewa | 0.0 /100 | #326 | Tragic 7.0% |
| Lumbee | 0.0 /100 | #327 | Tragic 7.1% |
| Natives/Alaskans | 0.0 /100 | #328 | Tragic 7.2% |
| Blacks/African Americans | 0.0 /100 | #329 | Tragic 7.3% |
| Colville | 0.0 /100 | #330 | Tragic 7.4% |
| Hopi | 0.0 /100 | #331 | Tragic 7.4% |
| Dominicans | 0.0 /100 | #332 | Tragic 7.5% |
| Immigrants | Dominican Republic | 0.0 /100 | #333 | Tragic 7.5% |
| Cheyenne | 0.0 /100 | #334 | Tragic 7.8% |
| Apache | 0.0 /100 | #335 | Tragic 7.9% |
| Sioux | 0.0 /100 | #336 | Tragic 7.9% |
| Yakama | 0.0 /100 | #337 | Tragic 8.1% |
| Immigrants | Yemen | 0.0 /100 | #338 | Tragic 8.2% |
Demographics Similar to Immigrants from Czechoslovakia by Unemployment Among Women with Children Under 18 years
In terms of unemployment among women with children under 18 years, the demographic groups most similar to Immigrants from Czechoslovakia are French Canadian (5.2%, a difference of 0.0%), Immigrants from Russia (5.2%, a difference of 0.020%), Immigrants from Eastern Europe (5.2%, a difference of 0.070%), French (5.2%, a difference of 0.090%), and Kenyan (5.3%, a difference of 0.13%).
| Demographics | Rating | Rank | Unemployment Among Women with Children Under 18 years |
| Sri Lankans | 90.3 /100 | #103 | Exceptional 5.2% |
| Immigrants | Switzerland | 90.1 /100 | #104 | Exceptional 5.2% |
| Immigrants | France | 90.0 /100 | #105 | Excellent 5.2% |
| Pakistanis | 89.9 /100 | #106 | Excellent 5.2% |
| Slavs | 89.8 /100 | #107 | Excellent 5.2% |
| Iranians | 89.7 /100 | #108 | Excellent 5.2% |
| Immigrants | Russia | 89.0 /100 | #109 | Excellent 5.2% |
| Immigrants | Czechoslovakia | 88.9 /100 | #110 | Excellent 5.2% |
| French Canadians | 88.9 /100 | #111 | Excellent 5.2% |
| Immigrants | Eastern Europe | 88.5 /100 | #112 | Excellent 5.2% |
| French | 88.4 /100 | #113 | Excellent 5.2% |
| Kenyans | 88.2 /100 | #114 | Excellent 5.3% |
| Hungarians | 88.1 /100 | #115 | Excellent 5.3% |
| Macedonians | 87.7 /100 | #116 | Excellent 5.3% |
| Canadians | 87.4 /100 | #117 | Excellent 5.3% |