Honduran vs Immigrants from Poland Unemployment Among Ages 30 to 34 years
COMPARE
Honduran
Immigrants from Poland
Unemployment Among Ages 30 to 34 years
Unemployment Among Ages 30 to 34 years Comparison
Hondurans
Immigrants from Poland
6.0%
UNEMPLOYMENT AMONG AGES 30 TO 34 YEARS
0.3/ 100
METRIC RATING
249th/ 347
METRIC RANK
5.3%
UNEMPLOYMENT AMONG AGES 30 TO 34 YEARS
82.4/ 100
METRIC RATING
120th/ 347
METRIC RANK
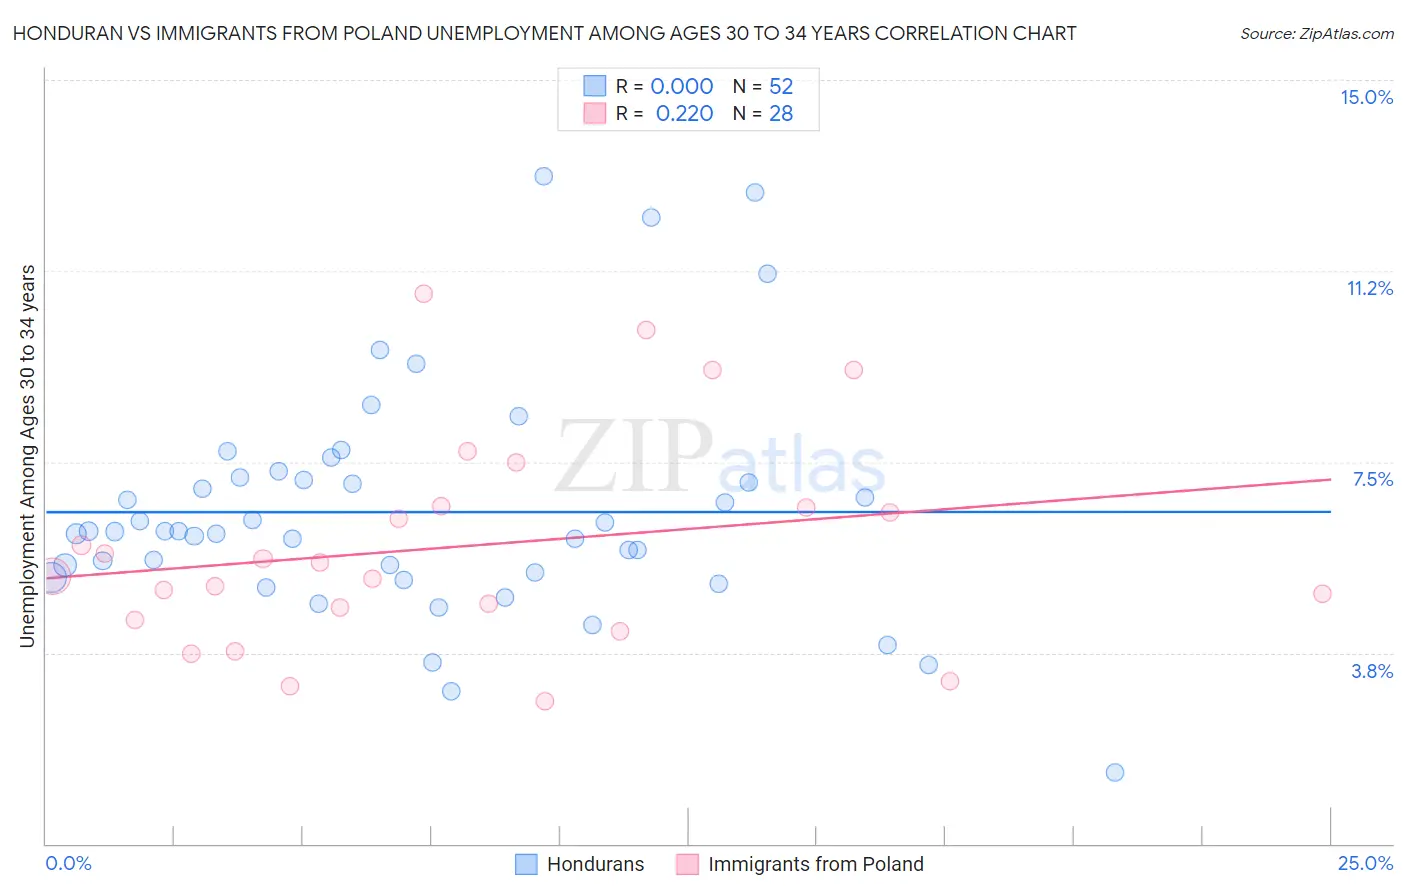
Honduran vs Immigrants from Poland Unemployment Among Ages 30 to 34 years Correlation Chart
The statistical analysis conducted on geographies consisting of 342,831,015 people shows no correlation between the proportion of Hondurans and unemployment rate among population between the ages 30 and 34 in the United States with a correlation coefficient (R) of 0.000 and weighted average of 6.0%. Similarly, the statistical analysis conducted on geographies consisting of 289,585,828 people shows a weak positive correlation between the proportion of Immigrants from Poland and unemployment rate among population between the ages 30 and 34 in the United States with a correlation coefficient (R) of 0.220 and weighted average of 5.3%, a difference of 13.2%.
Unemployment Among Ages 30 to 34 years Correlation Summary
| Measurement | Honduran | Immigrants from Poland |
| Minimum | 1.4% | 2.8% |
| Maximum | 13.1% | 10.8% |
| Range | 11.7% | 8.0% |
| Mean | 6.5% | 5.8% |
| Median | 6.1% | 5.4% |
| Interquartile 25% (IQ1) | 5.3% | 4.5% |
| Interquartile 75% (IQ3) | 7.2% | 6.6% |
| Interquartile Range (IQR) | 1.9% | 2.1% |
| Standard Deviation (Sample) | 2.3% | 2.1% |
| Standard Deviation (Population) | 2.3% | 2.1% |
Similar Demographics by Unemployment Among Ages 30 to 34 years
Demographics Similar to Hondurans by Unemployment Among Ages 30 to 34 years
In terms of unemployment among ages 30 to 34 years, the demographic groups most similar to Hondurans are Immigrants from Guatemala (6.0%, a difference of 0.0%), Nigerian (6.0%, a difference of 0.010%), Ghanaian (6.0%, a difference of 0.070%), Immigrants from Honduras (6.0%, a difference of 0.090%), and Subsaharan African (6.0%, a difference of 0.25%).
| Demographics | Rating | Rank | Unemployment Among Ages 30 to 34 years |
| Guatemalans | 0.4 /100 | #242 | Tragic 6.0% |
| Immigrants | Liberia | 0.4 /100 | #243 | Tragic 6.0% |
| Immigrants | Micronesia | 0.3 /100 | #244 | Tragic 6.0% |
| Sub-Saharan Africans | 0.3 /100 | #245 | Tragic 6.0% |
| Ghanaians | 0.3 /100 | #246 | Tragic 6.0% |
| Nigerians | 0.3 /100 | #247 | Tragic 6.0% |
| Immigrants | Guatemala | 0.3 /100 | #248 | Tragic 6.0% |
| Hondurans | 0.3 /100 | #249 | Tragic 6.0% |
| Immigrants | Honduras | 0.3 /100 | #250 | Tragic 6.0% |
| Tlingit-Haida | 0.2 /100 | #251 | Tragic 6.0% |
| Potawatomi | 0.2 /100 | #252 | Tragic 6.0% |
| Immigrants | Nonimmigrants | 0.2 /100 | #253 | Tragic 6.1% |
| Armenians | 0.1 /100 | #254 | Tragic 6.1% |
| Immigrants | Portugal | 0.1 /100 | #255 | Tragic 6.1% |
| Immigrants | Ghana | 0.1 /100 | #256 | Tragic 6.1% |
Demographics Similar to Immigrants from Poland by Unemployment Among Ages 30 to 34 years
In terms of unemployment among ages 30 to 34 years, the demographic groups most similar to Immigrants from Poland are New Zealander (5.3%, a difference of 0.010%), Romanian (5.3%, a difference of 0.010%), Immigrants from Netherlands (5.3%, a difference of 0.070%), Immigrants from South Africa (5.3%, a difference of 0.080%), and Australian (5.3%, a difference of 0.090%).
| Demographics | Rating | Rank | Unemployment Among Ages 30 to 34 years |
| Immigrants | Spain | 85.6 /100 | #113 | Excellent 5.3% |
| Estonians | 83.7 /100 | #114 | Excellent 5.3% |
| Immigrants | Albania | 83.4 /100 | #115 | Excellent 5.3% |
| Eastern Europeans | 83.2 /100 | #116 | Excellent 5.3% |
| Australians | 83.1 /100 | #117 | Excellent 5.3% |
| Immigrants | South Africa | 83.0 /100 | #118 | Excellent 5.3% |
| New Zealanders | 82.5 /100 | #119 | Excellent 5.3% |
| Immigrants | Poland | 82.4 /100 | #120 | Excellent 5.3% |
| Romanians | 82.3 /100 | #121 | Excellent 5.3% |
| Immigrants | Netherlands | 81.8 /100 | #122 | Excellent 5.3% |
| Immigrants | Italy | 81.1 /100 | #123 | Excellent 5.3% |
| Immigrants | Brazil | 80.8 /100 | #124 | Excellent 5.3% |
| Greeks | 80.4 /100 | #125 | Excellent 5.3% |
| Immigrants | Sri Lanka | 80.2 /100 | #126 | Excellent 5.3% |
| Taiwanese | 79.4 /100 | #127 | Good 5.3% |