Honduran vs Immigrants from Italy Unemployment Among Youth under 25 years
COMPARE
Honduran
Immigrants from Italy
Unemployment Among Youth under 25 years
Unemployment Among Youth under 25 years Comparison
Hondurans
Immigrants from Italy
12.3%
UNEMPLOYMENT AMONG YOUTH UNDER 25 YEARS
0.3/ 100
METRIC RATING
254th/ 347
METRIC RANK
11.7%
UNEMPLOYMENT AMONG YOUTH UNDER 25 YEARS
36.2/ 100
METRIC RATING
182nd/ 347
METRIC RANK
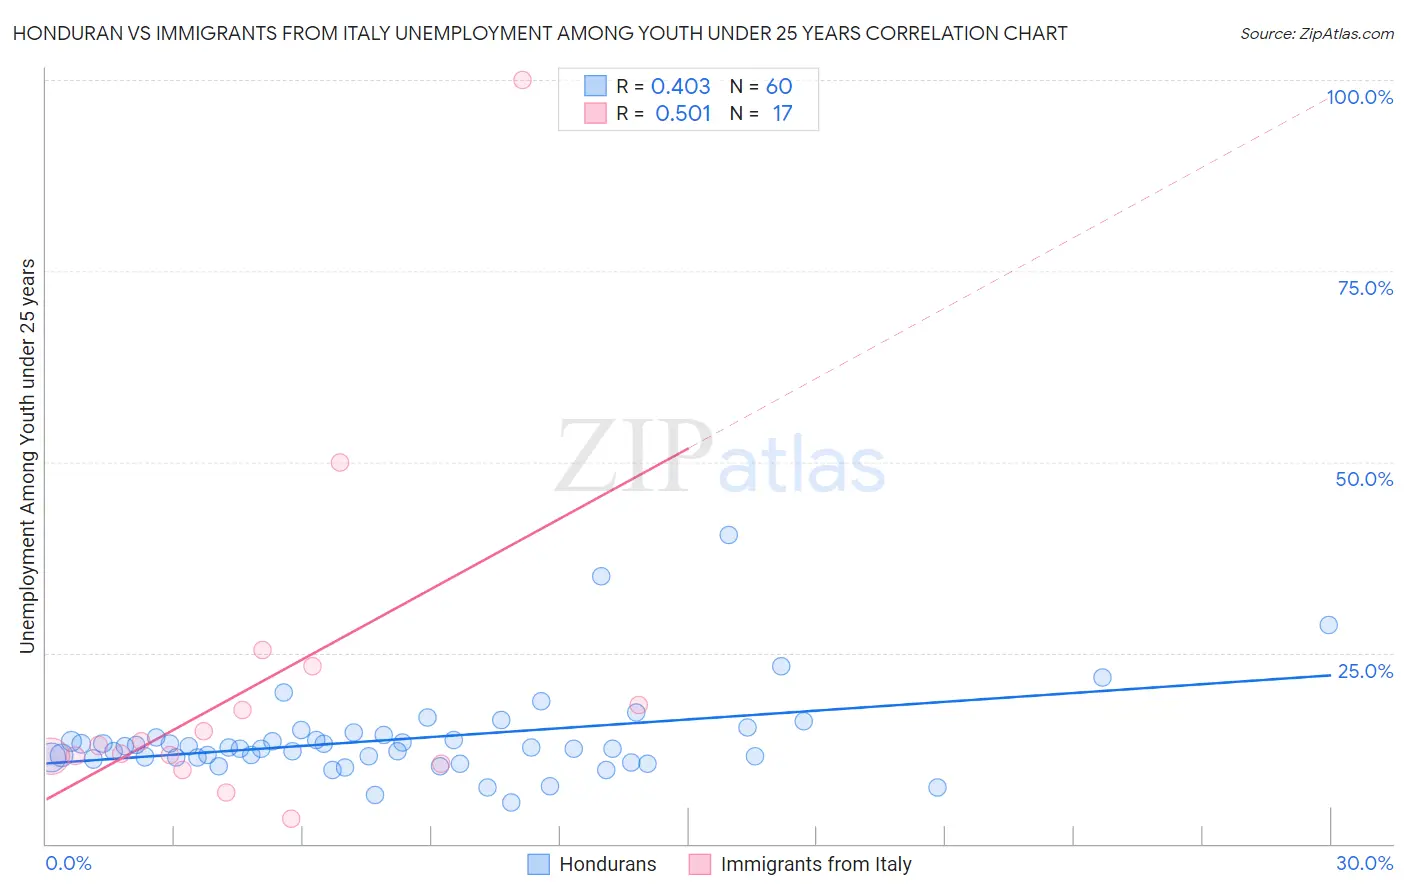
Honduran vs Immigrants from Italy Unemployment Among Youth under 25 years Correlation Chart
The statistical analysis conducted on geographies consisting of 354,810,138 people shows a moderate positive correlation between the proportion of Hondurans and unemployment rate among youth under the age of 25 in the United States with a correlation coefficient (R) of 0.403 and weighted average of 12.3%. Similarly, the statistical analysis conducted on geographies consisting of 320,425,921 people shows a substantial positive correlation between the proportion of Immigrants from Italy and unemployment rate among youth under the age of 25 in the United States with a correlation coefficient (R) of 0.501 and weighted average of 11.7%, a difference of 5.3%.
Unemployment Among Youth under 25 years Correlation Summary
| Measurement | Honduran | Immigrants from Italy |
| Minimum | 5.4% | 3.3% |
| Maximum | 40.4% | 100.0% |
| Range | 35.0% | 96.7% |
| Mean | 13.8% | 20.7% |
| Median | 12.5% | 12.9% |
| Interquartile 25% (IQ1) | 11.3% | 11.0% |
| Interquartile 75% (IQ3) | 14.1% | 20.7% |
| Interquartile Range (IQR) | 2.8% | 9.7% |
| Standard Deviation (Sample) | 5.9% | 22.9% |
| Standard Deviation (Population) | 5.9% | 22.2% |
Similar Demographics by Unemployment Among Youth under 25 years
Demographics Similar to Hondurans by Unemployment Among Youth under 25 years
In terms of unemployment among youth under 25 years, the demographic groups most similar to Hondurans are Mexican (12.3%, a difference of 0.020%), Immigrants from Syria (12.3%, a difference of 0.060%), Mexican American Indian (12.3%, a difference of 0.10%), Delaware (12.3%, a difference of 0.13%), and Soviet Union (12.2%, a difference of 0.54%).
| Demographics | Rating | Rank | Unemployment Among Youth under 25 years |
| Immigrants | Greece | 0.6 /100 | #247 | Tragic 12.2% |
| Central Americans | 0.6 /100 | #248 | Tragic 12.2% |
| Soviet Union | 0.6 /100 | #249 | Tragic 12.2% |
| Delaware | 0.4 /100 | #250 | Tragic 12.3% |
| Mexican American Indians | 0.4 /100 | #251 | Tragic 12.3% |
| Immigrants | Syria | 0.3 /100 | #252 | Tragic 12.3% |
| Mexicans | 0.3 /100 | #253 | Tragic 12.3% |
| Hondurans | 0.3 /100 | #254 | Tragic 12.3% |
| Hispanics or Latinos | 0.2 /100 | #255 | Tragic 12.4% |
| Liberians | 0.2 /100 | #256 | Tragic 12.4% |
| Panamanians | 0.2 /100 | #257 | Tragic 12.4% |
| Salvadorans | 0.1 /100 | #258 | Tragic 12.4% |
| Immigrants | Central America | 0.1 /100 | #259 | Tragic 12.4% |
| Immigrants | Panama | 0.1 /100 | #260 | Tragic 12.4% |
| Immigrants | El Salvador | 0.1 /100 | #261 | Tragic 12.4% |
Demographics Similar to Immigrants from Italy by Unemployment Among Youth under 25 years
In terms of unemployment among youth under 25 years, the demographic groups most similar to Immigrants from Italy are American (11.7%, a difference of 0.080%), Immigrants from Eastern Europe (11.7%, a difference of 0.090%), Syrian (11.7%, a difference of 0.10%), French American Indian (11.7%, a difference of 0.10%), and Maltese (11.7%, a difference of 0.10%).
| Demographics | Rating | Rank | Unemployment Among Youth under 25 years |
| Immigrants | Iraq | 47.0 /100 | #175 | Average 11.6% |
| Ugandans | 45.6 /100 | #176 | Average 11.6% |
| Immigrants | Denmark | 45.0 /100 | #177 | Average 11.6% |
| Immigrants | Europe | 42.4 /100 | #178 | Average 11.6% |
| Immigrants | Hong Kong | 42.4 /100 | #179 | Average 11.6% |
| Spaniards | 39.8 /100 | #180 | Fair 11.7% |
| Syrians | 38.4 /100 | #181 | Fair 11.7% |
| Immigrants | Italy | 36.2 /100 | #182 | Fair 11.7% |
| Americans | 34.5 /100 | #183 | Fair 11.7% |
| Immigrants | Eastern Europe | 34.1 /100 | #184 | Fair 11.7% |
| French American Indians | 34.0 /100 | #185 | Fair 11.7% |
| Maltese | 33.9 /100 | #186 | Fair 11.7% |
| Immigrants | Egypt | 31.9 /100 | #187 | Fair 11.7% |
| Immigrants | Poland | 31.4 /100 | #188 | Fair 11.7% |
| Japanese | 30.8 /100 | #189 | Fair 11.7% |