Hmong vs Immigrants from Guyana Unemployment Among Ages 45 to 54 years
COMPARE
Hmong
Immigrants from Guyana
Unemployment Among Ages 45 to 54 years
Unemployment Among Ages 45 to 54 years Comparison
Hmong
Immigrants from Guyana
3.7%
UNEMPLOYMENT AMONG AGES 45 TO 54 YEARS
100.0/ 100
METRIC RATING
1st/ 347
METRIC RANK
5.6%
UNEMPLOYMENT AMONG AGES 45 TO 54 YEARS
0.0/ 100
METRIC RATING
316th/ 347
METRIC RANK
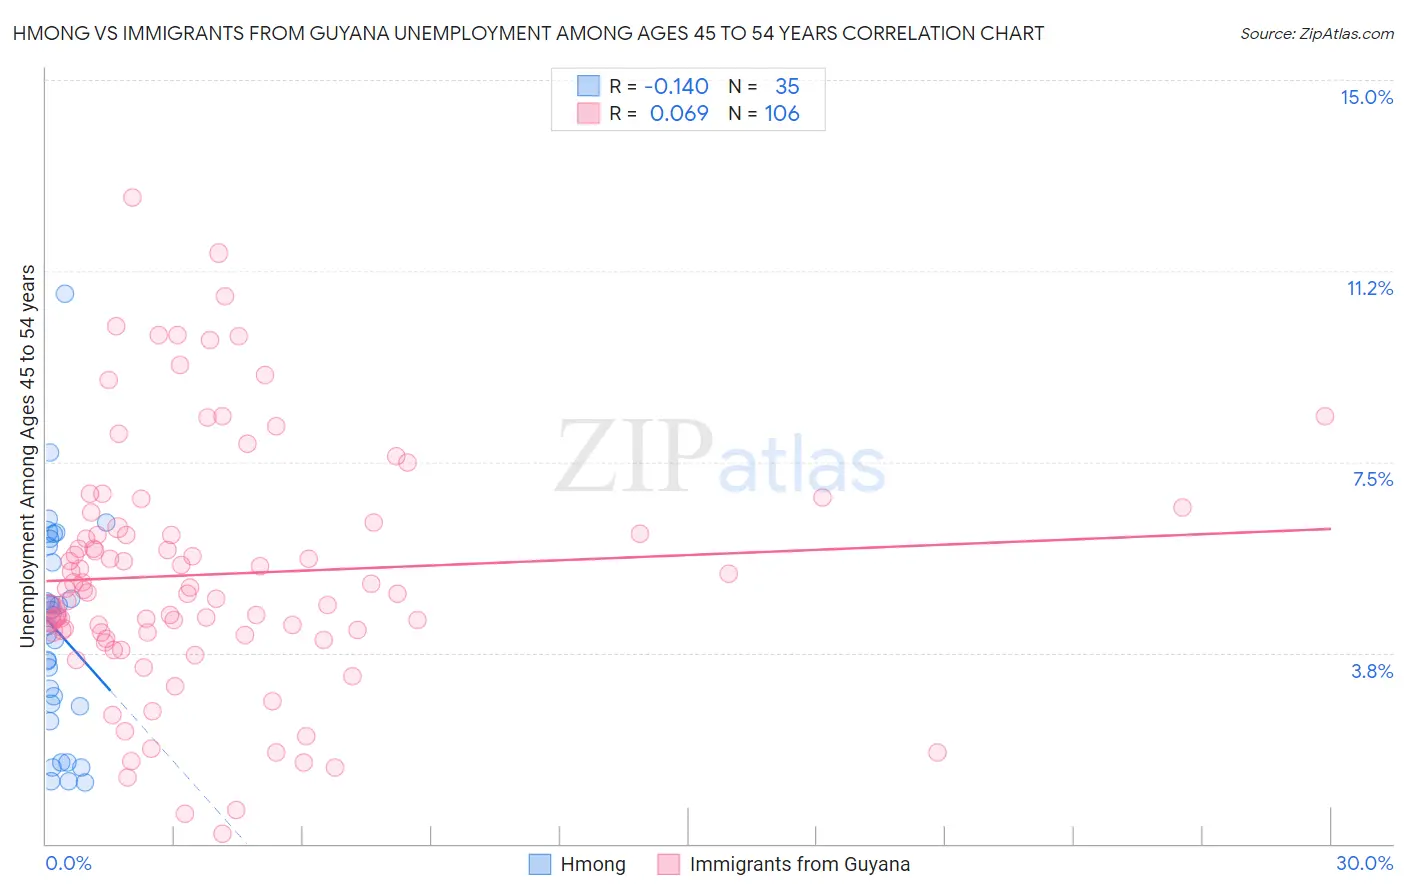
Hmong vs Immigrants from Guyana Unemployment Among Ages 45 to 54 years Correlation Chart
The statistical analysis conducted on geographies consisting of 24,607,345 people shows a poor negative correlation between the proportion of Hmong and unemployment rate among population between the ages 45 and 54 in the United States with a correlation coefficient (R) of -0.140 and weighted average of 3.7%. Similarly, the statistical analysis conducted on geographies consisting of 181,592,956 people shows a slight positive correlation between the proportion of Immigrants from Guyana and unemployment rate among population between the ages 45 and 54 in the United States with a correlation coefficient (R) of 0.069 and weighted average of 5.6%, a difference of 50.6%.
Unemployment Among Ages 45 to 54 years Correlation Summary
| Measurement | Hmong | Immigrants from Guyana |
| Minimum | 1.2% | 0.20% |
| Maximum | 10.8% | 12.7% |
| Range | 9.6% | 12.5% |
| Mean | 4.2% | 5.3% |
| Median | 4.3% | 5.0% |
| Interquartile 25% (IQ1) | 2.7% | 4.1% |
| Interquartile 75% (IQ3) | 5.9% | 6.2% |
| Interquartile Range (IQR) | 3.2% | 2.1% |
| Standard Deviation (Sample) | 2.1% | 2.4% |
| Standard Deviation (Population) | 2.1% | 2.4% |
Similar Demographics by Unemployment Among Ages 45 to 54 years
Demographics Similar to Hmong by Unemployment Among Ages 45 to 54 years
In terms of unemployment among ages 45 to 54 years, the demographic groups most similar to Hmong are Fijian (3.8%, a difference of 0.78%), Norwegian (3.9%, a difference of 3.1%), Immigrants from India (3.9%, a difference of 4.0%), Danish (3.9%, a difference of 4.2%), and Immigrants from Cuba (3.9%, a difference of 4.4%).
| Demographics | Rating | Rank | Unemployment Among Ages 45 to 54 years |
| Hmong | 100.0 /100 | #1 | Exceptional 3.7% |
| Fijians | 100.0 /100 | #2 | Exceptional 3.8% |
| Norwegians | 100.0 /100 | #3 | Exceptional 3.9% |
| Immigrants | India | 100.0 /100 | #4 | Exceptional 3.9% |
| Danes | 100.0 /100 | #5 | Exceptional 3.9% |
| Immigrants | Cuba | 100.0 /100 | #6 | Exceptional 3.9% |
| Immigrants | Venezuela | 100.0 /100 | #7 | Exceptional 3.9% |
| Chinese | 100.0 /100 | #8 | Exceptional 4.0% |
| Czechs | 100.0 /100 | #9 | Exceptional 4.0% |
| Venezuelans | 100.0 /100 | #10 | Exceptional 4.0% |
| Scandinavians | 100.0 /100 | #11 | Exceptional 4.0% |
| Swedes | 100.0 /100 | #12 | Exceptional 4.0% |
| Cubans | 100.0 /100 | #13 | Exceptional 4.0% |
| Immigrants | Bosnia and Herzegovina | 100.0 /100 | #14 | Exceptional 4.0% |
| Immigrants | Bolivia | 100.0 /100 | #15 | Exceptional 4.0% |
Demographics Similar to Immigrants from Guyana by Unemployment Among Ages 45 to 54 years
In terms of unemployment among ages 45 to 54 years, the demographic groups most similar to Immigrants from Guyana are Houma (5.6%, a difference of 0.10%), Immigrants from Dominica (5.6%, a difference of 0.20%), Guyanese (5.6%, a difference of 0.38%), Shoshone (5.6%, a difference of 0.71%), and British West Indian (5.7%, a difference of 0.72%).
| Demographics | Rating | Rank | Unemployment Among Ages 45 to 54 years |
| Barbadians | 0.0 /100 | #309 | Tragic 5.5% |
| Immigrants | Barbados | 0.0 /100 | #310 | Tragic 5.5% |
| Chippewa | 0.0 /100 | #311 | Tragic 5.5% |
| Immigrants | Grenada | 0.0 /100 | #312 | Tragic 5.6% |
| Shoshone | 0.0 /100 | #313 | Tragic 5.6% |
| Guyanese | 0.0 /100 | #314 | Tragic 5.6% |
| Immigrants | Dominica | 0.0 /100 | #315 | Tragic 5.6% |
| Immigrants | Guyana | 0.0 /100 | #316 | Tragic 5.6% |
| Houma | 0.0 /100 | #317 | Tragic 5.6% |
| British West Indians | 0.0 /100 | #318 | Tragic 5.7% |
| Cape Verdeans | 0.0 /100 | #319 | Tragic 5.7% |
| Immigrants | St. Vincent and the Grenadines | 0.0 /100 | #320 | Tragic 5.7% |
| Yakama | 0.0 /100 | #321 | Tragic 5.7% |
| Immigrants | Azores | 0.0 /100 | #322 | Tragic 5.7% |
| Immigrants | Cabo Verde | 0.0 /100 | #323 | Tragic 5.9% |