Hispanic or Latino vs Swedish Unemployment Among Women with Children Under 18 years
COMPARE
Hispanic or Latino
Swedish
Unemployment Among Women with Children Under 18 years
Unemployment Among Women with Children Under 18 years Comparison
Hispanics or Latinos
Swedes
6.6%
UNEMPLOYMENT AMONG WOMEN WITH CHILDREN UNDER 18 YEARS
0.0/ 100
METRIC RATING
313th/ 347
METRIC RANK
4.7%
UNEMPLOYMENT AMONG WOMEN WITH CHILDREN UNDER 18 YEARS
100.0/ 100
METRIC RATING
4th/ 347
METRIC RANK
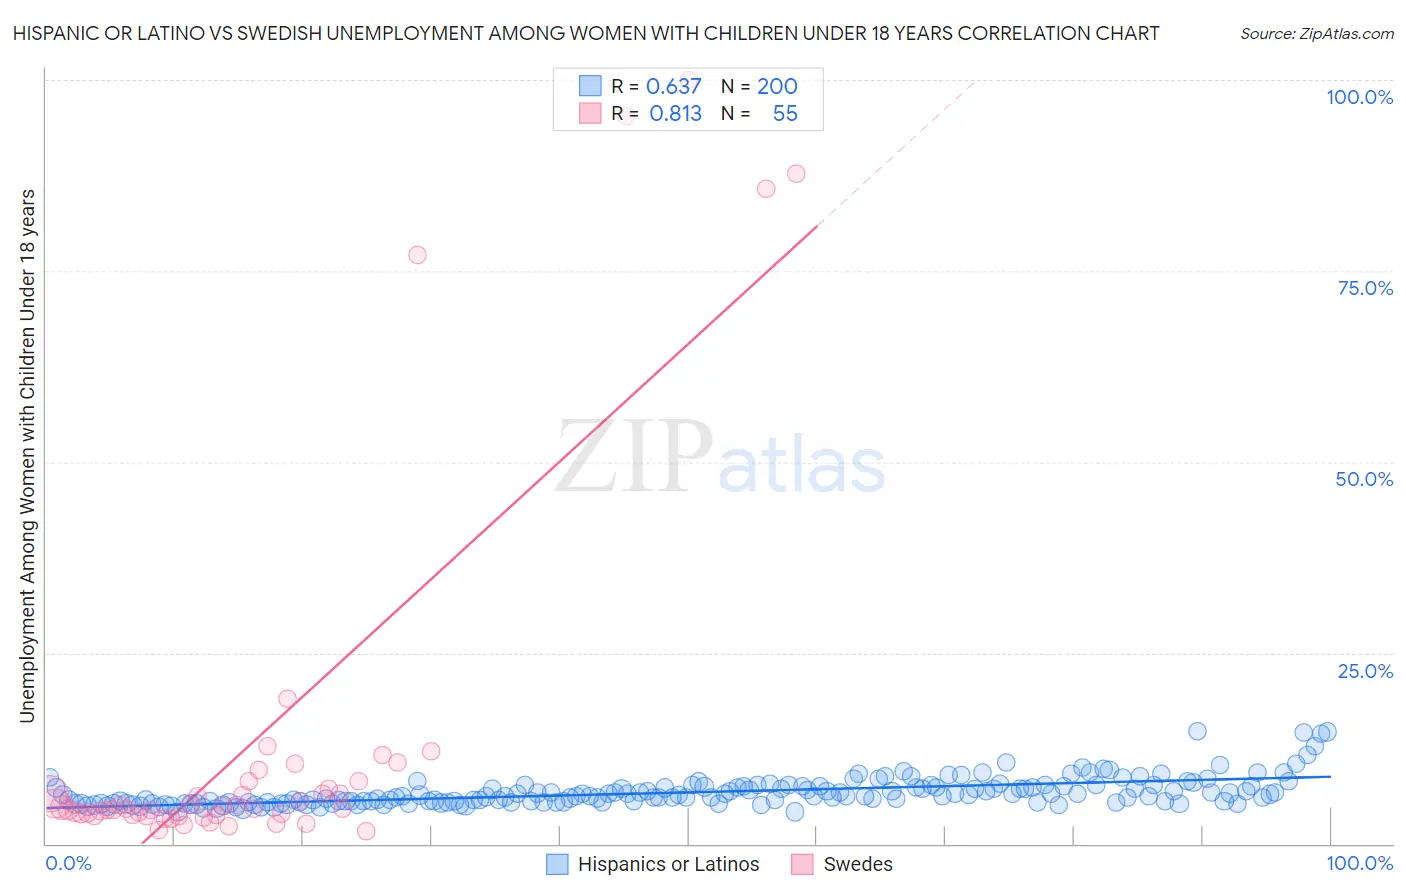
Hispanic or Latino vs Swedish Unemployment Among Women with Children Under 18 years Correlation Chart
The statistical analysis conducted on geographies consisting of 521,591,164 people shows a significant positive correlation between the proportion of Hispanics or Latinos and unemployment rate among women with children under the age of 18 in the United States with a correlation coefficient (R) of 0.637 and weighted average of 6.6%. Similarly, the statistical analysis conducted on geographies consisting of 492,150,617 people shows a very strong positive correlation between the proportion of Swedes and unemployment rate among women with children under the age of 18 in the United States with a correlation coefficient (R) of 0.813 and weighted average of 4.7%, a difference of 41.7%.
Unemployment Among Women with Children Under 18 years Correlation Summary
| Measurement | Hispanic or Latino | Swedish |
| Minimum | 4.1% | 1.6% |
| Maximum | 14.7% | 100.0% |
| Range | 10.6% | 98.4% |
| Mean | 6.7% | 13.2% |
| Median | 6.2% | 4.7% |
| Interquartile 25% (IQ1) | 5.4% | 3.8% |
| Interquartile 75% (IQ3) | 7.5% | 8.1% |
| Interquartile Range (IQR) | 2.0% | 4.3% |
| Standard Deviation (Sample) | 1.9% | 24.6% |
| Standard Deviation (Population) | 1.9% | 24.3% |
Similar Demographics by Unemployment Among Women with Children Under 18 years
Demographics Similar to Hispanics or Latinos by Unemployment Among Women with Children Under 18 years
In terms of unemployment among women with children under 18 years, the demographic groups most similar to Hispanics or Latinos are British West Indian (6.6%, a difference of 0.14%), Immigrants from West Indies (6.6%, a difference of 0.14%), Immigrants from Mexico (6.6%, a difference of 0.29%), Yaqui (6.6%, a difference of 0.38%), and Immigrants from Ecuador (6.6%, a difference of 0.48%).
| Demographics | Rating | Rank | Unemployment Among Women with Children Under 18 years |
| Immigrants | Guyana | 0.0 /100 | #306 | Tragic 6.5% |
| Belizeans | 0.0 /100 | #307 | Tragic 6.5% |
| Africans | 0.0 /100 | #308 | Tragic 6.5% |
| Ecuadorians | 0.0 /100 | #309 | Tragic 6.5% |
| Guyanese | 0.0 /100 | #310 | Tragic 6.6% |
| Yaqui | 0.0 /100 | #311 | Tragic 6.6% |
| Immigrants | Mexico | 0.0 /100 | #312 | Tragic 6.6% |
| Hispanics or Latinos | 0.0 /100 | #313 | Tragic 6.6% |
| British West Indians | 0.0 /100 | #314 | Tragic 6.6% |
| Immigrants | West Indies | 0.0 /100 | #315 | Tragic 6.6% |
| Immigrants | Ecuador | 0.0 /100 | #316 | Tragic 6.6% |
| Shoshone | 0.0 /100 | #317 | Tragic 6.6% |
| Alaska Natives | 0.0 /100 | #318 | Tragic 6.7% |
| Central American Indians | 0.0 /100 | #319 | Tragic 6.7% |
| Immigrants | Belize | 0.0 /100 | #320 | Tragic 6.7% |
Demographics Similar to Swedes by Unemployment Among Women with Children Under 18 years
In terms of unemployment among women with children under 18 years, the demographic groups most similar to Swedes are Tongan (4.7%, a difference of 0.050%), Immigrants from Taiwan (4.7%, a difference of 0.16%), Immigrants from India (4.7%, a difference of 0.27%), Immigrants from Hong Kong (4.7%, a difference of 0.69%), and Okinawan (4.7%, a difference of 1.5%).
| Demographics | Rating | Rank | Unemployment Among Women with Children Under 18 years |
| Norwegians | 100.0 /100 | #1 | Exceptional 4.4% |
| Hmong | 100.0 /100 | #2 | Exceptional 4.5% |
| Danes | 100.0 /100 | #3 | Exceptional 4.5% |
| Swedes | 100.0 /100 | #4 | Exceptional 4.7% |
| Tongans | 100.0 /100 | #5 | Exceptional 4.7% |
| Immigrants | Taiwan | 100.0 /100 | #6 | Exceptional 4.7% |
| Immigrants | India | 100.0 /100 | #7 | Exceptional 4.7% |
| Immigrants | Hong Kong | 100.0 /100 | #8 | Exceptional 4.7% |
| Okinawans | 99.9 /100 | #9 | Exceptional 4.7% |
| Czechs | 99.9 /100 | #10 | Exceptional 4.7% |
| Filipinos | 99.9 /100 | #11 | Exceptional 4.8% |
| Scandinavians | 99.9 /100 | #12 | Exceptional 4.8% |
| Bulgarians | 99.9 /100 | #13 | Exceptional 4.8% |
| Cambodians | 99.9 /100 | #14 | Exceptional 4.8% |
| Thais | 99.8 /100 | #15 | Exceptional 4.8% |