Hispanic or Latino vs Slovak Unemployment Among Youth under 25 years
COMPARE
Hispanic or Latino
Slovak
Unemployment Among Youth under 25 years
Unemployment Among Youth under 25 years Comparison
Hispanics or Latinos
Slovaks
12.4%
UNEMPLOYMENT AMONG YOUTH UNDER 25 YEARS
0.2/ 100
METRIC RATING
255th/ 347
METRIC RANK
11.4%
UNEMPLOYMENT AMONG YOUTH UNDER 25 YEARS
88.9/ 100
METRIC RATING
121st/ 347
METRIC RANK
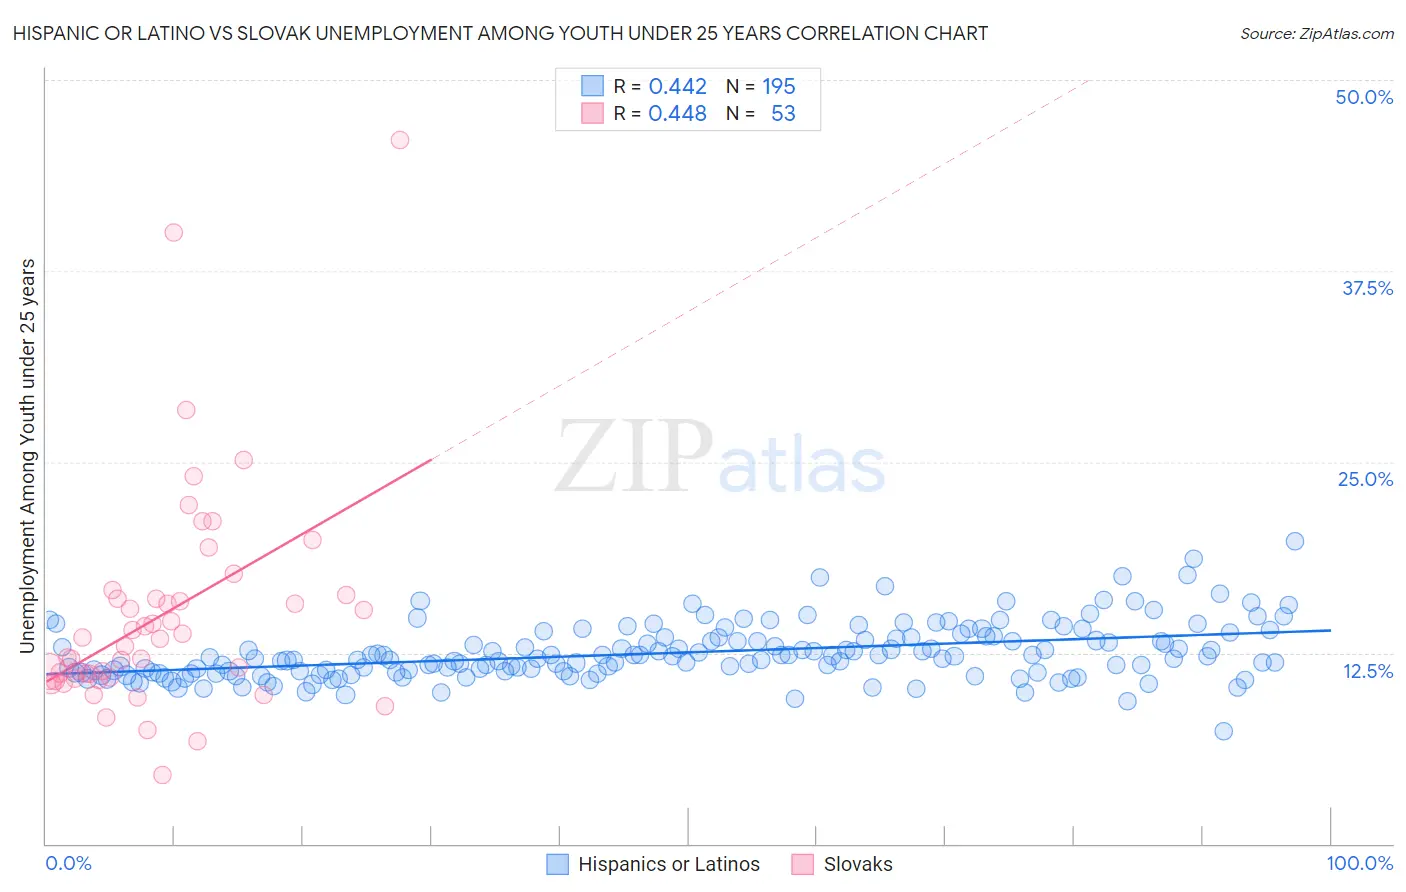
Hispanic or Latino vs Slovak Unemployment Among Youth under 25 years Correlation Chart
The statistical analysis conducted on geographies consisting of 547,783,299 people shows a moderate positive correlation between the proportion of Hispanics or Latinos and unemployment rate among youth under the age of 25 in the United States with a correlation coefficient (R) of 0.442 and weighted average of 12.4%. Similarly, the statistical analysis conducted on geographies consisting of 390,838,184 people shows a moderate positive correlation between the proportion of Slovaks and unemployment rate among youth under the age of 25 in the United States with a correlation coefficient (R) of 0.448 and weighted average of 11.4%, a difference of 8.9%.
Unemployment Among Youth under 25 years Correlation Summary
| Measurement | Hispanic or Latino | Slovak |
| Minimum | 7.4% | 4.5% |
| Maximum | 19.8% | 46.1% |
| Range | 12.5% | 41.6% |
| Mean | 12.5% | 15.0% |
| Median | 12.1% | 13.4% |
| Interquartile 25% (IQ1) | 11.2% | 10.9% |
| Interquartile 75% (IQ3) | 13.5% | 16.2% |
| Interquartile Range (IQR) | 2.2% | 5.3% |
| Standard Deviation (Sample) | 1.8% | 7.3% |
| Standard Deviation (Population) | 1.8% | 7.3% |
Similar Demographics by Unemployment Among Youth under 25 years
Demographics Similar to Hispanics or Latinos by Unemployment Among Youth under 25 years
In terms of unemployment among youth under 25 years, the demographic groups most similar to Hispanics or Latinos are Liberian (12.4%, a difference of 0.070%), Panamanian (12.4%, a difference of 0.080%), Salvadoran (12.4%, a difference of 0.11%), Immigrants from Central America (12.4%, a difference of 0.17%), and Immigrants from Panama (12.4%, a difference of 0.47%).
| Demographics | Rating | Rank | Unemployment Among Youth under 25 years |
| Central Americans | 0.6 /100 | #248 | Tragic 12.2% |
| Soviet Union | 0.6 /100 | #249 | Tragic 12.2% |
| Delaware | 0.4 /100 | #250 | Tragic 12.3% |
| Mexican American Indians | 0.4 /100 | #251 | Tragic 12.3% |
| Immigrants | Syria | 0.3 /100 | #252 | Tragic 12.3% |
| Mexicans | 0.3 /100 | #253 | Tragic 12.3% |
| Hondurans | 0.3 /100 | #254 | Tragic 12.3% |
| Hispanics or Latinos | 0.2 /100 | #255 | Tragic 12.4% |
| Liberians | 0.2 /100 | #256 | Tragic 12.4% |
| Panamanians | 0.2 /100 | #257 | Tragic 12.4% |
| Salvadorans | 0.1 /100 | #258 | Tragic 12.4% |
| Immigrants | Central America | 0.1 /100 | #259 | Tragic 12.4% |
| Immigrants | Panama | 0.1 /100 | #260 | Tragic 12.4% |
| Immigrants | El Salvador | 0.1 /100 | #261 | Tragic 12.4% |
| Immigrants | Mexico | 0.1 /100 | #262 | Tragic 12.4% |
Demographics Similar to Slovaks by Unemployment Among Youth under 25 years
In terms of unemployment among youth under 25 years, the demographic groups most similar to Slovaks are Malaysian (11.4%, a difference of 0.020%), Immigrants from Scotland (11.4%, a difference of 0.040%), Immigrants from Micronesia (11.4%, a difference of 0.080%), Afghan (11.3%, a difference of 0.090%), and Burmese (11.3%, a difference of 0.10%).
| Demographics | Rating | Rank | Unemployment Among Youth under 25 years |
| Immigrants | Ethiopia | 89.9 /100 | #114 | Excellent 11.3% |
| Immigrants | Vietnam | 89.9 /100 | #115 | Excellent 11.3% |
| Burmese | 89.8 /100 | #116 | Excellent 11.3% |
| Sri Lankans | 89.8 /100 | #117 | Excellent 11.3% |
| Afghans | 89.7 /100 | #118 | Excellent 11.3% |
| Immigrants | Scotland | 89.2 /100 | #119 | Excellent 11.4% |
| Malaysians | 89.0 /100 | #120 | Excellent 11.4% |
| Slovaks | 88.9 /100 | #121 | Excellent 11.4% |
| Immigrants | Micronesia | 88.1 /100 | #122 | Excellent 11.4% |
| Basques | 87.8 /100 | #123 | Excellent 11.4% |
| Italians | 87.2 /100 | #124 | Excellent 11.4% |
| Immigrants | Argentina | 87.2 /100 | #125 | Excellent 11.4% |
| Canadians | 86.6 /100 | #126 | Excellent 11.4% |
| Greeks | 86.2 /100 | #127 | Excellent 11.4% |
| Immigrants | Hungary | 86.0 /100 | #128 | Excellent 11.4% |