Hawaiian vs Swiss Unemployment Among Ages 16 to 19 years
COMPARE
Hawaiian
Swiss
Unemployment Among Ages 16 to 19 years
Unemployment Among Ages 16 to 19 years Comparison
Hawaiians
Swiss
17.9%
UNEMPLOYMENT AMONG AGES 16 TO 19 YEARS
16.8/ 100
METRIC RATING
208th/ 347
METRIC RANK
15.8%
UNEMPLOYMENT AMONG AGES 16 TO 19 YEARS
100.0/ 100
METRIC RATING
19th/ 347
METRIC RANK
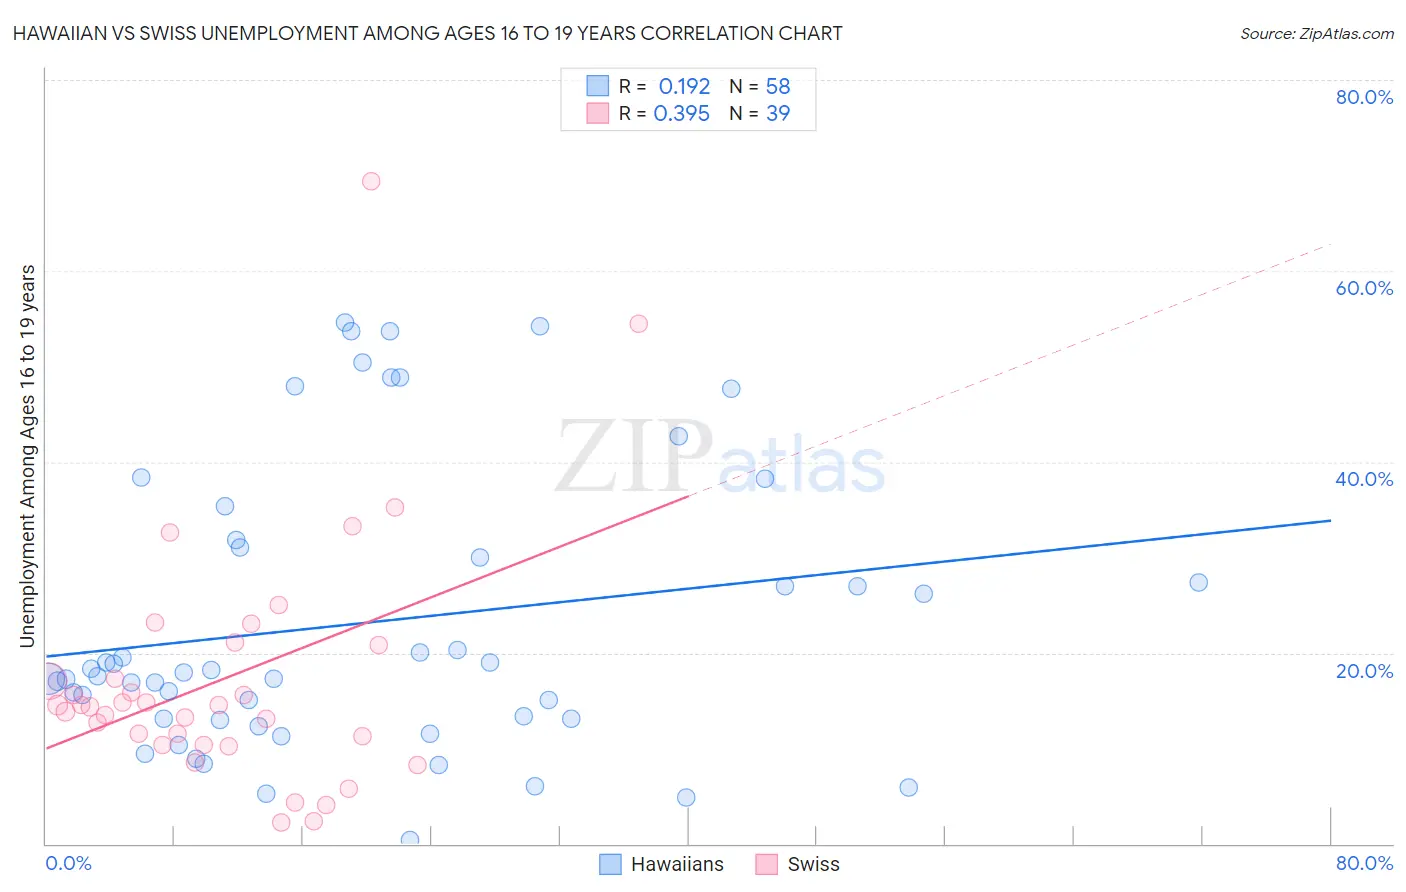
Hawaiian vs Swiss Unemployment Among Ages 16 to 19 years Correlation Chart
The statistical analysis conducted on geographies consisting of 314,037,858 people shows a poor positive correlation between the proportion of Hawaiians and unemployment rate among population between the ages 16 and 19 in the United States with a correlation coefficient (R) of 0.192 and weighted average of 17.9%. Similarly, the statistical analysis conducted on geographies consisting of 429,339,999 people shows a mild positive correlation between the proportion of Swiss and unemployment rate among population between the ages 16 and 19 in the United States with a correlation coefficient (R) of 0.395 and weighted average of 15.8%, a difference of 13.7%.
Unemployment Among Ages 16 to 19 years Correlation Summary
| Measurement | Hawaiian | Swiss |
| Minimum | 0.40% | 2.2% |
| Maximum | 54.5% | 69.4% |
| Range | 54.1% | 67.2% |
| Mean | 23.1% | 17.3% |
| Median | 17.7% | 14.5% |
| Interquartile 25% (IQ1) | 13.1% | 10.3% |
| Interquartile 75% (IQ3) | 31.0% | 20.8% |
| Interquartile Range (IQR) | 17.9% | 10.5% |
| Standard Deviation (Sample) | 14.9% | 13.1% |
| Standard Deviation (Population) | 14.7% | 12.9% |
Similar Demographics by Unemployment Among Ages 16 to 19 years
Demographics Similar to Hawaiians by Unemployment Among Ages 16 to 19 years
In terms of unemployment among ages 16 to 19 years, the demographic groups most similar to Hawaiians are Cherokee (17.9%, a difference of 0.090%), Carpatho Rusyn (17.9%, a difference of 0.10%), Liberian (17.9%, a difference of 0.15%), Immigrants from Southern Europe (17.9%, a difference of 0.17%), and Guamanian/Chamorro (17.9%, a difference of 0.20%).
| Demographics | Rating | Rank | Unemployment Among Ages 16 to 19 years |
| Immigrants | Ethiopia | 27.4 /100 | #201 | Fair 17.8% |
| Immigrants | Portugal | 27.2 /100 | #202 | Fair 17.8% |
| Immigrants | Eastern Europe | 23.6 /100 | #203 | Fair 17.8% |
| Immigrants | Nonimmigrants | 20.9 /100 | #204 | Fair 17.9% |
| Assyrians/Chaldeans/Syriacs | 20.8 /100 | #205 | Fair 17.9% |
| Immigrants | Southern Europe | 18.9 /100 | #206 | Poor 17.9% |
| Liberians | 18.6 /100 | #207 | Poor 17.9% |
| Hawaiians | 16.8 /100 | #208 | Poor 17.9% |
| Cherokee | 15.7 /100 | #209 | Poor 17.9% |
| Carpatho Rusyns | 15.6 /100 | #210 | Poor 17.9% |
| Guamanians/Chamorros | 14.5 /100 | #211 | Poor 17.9% |
| Argentineans | 13.8 /100 | #212 | Poor 18.0% |
| Chippewa | 13.7 /100 | #213 | Poor 18.0% |
| Immigrants | Morocco | 13.5 /100 | #214 | Poor 18.0% |
| Immigrants | Syria | 13.3 /100 | #215 | Poor 18.0% |
Demographics Similar to Swiss by Unemployment Among Ages 16 to 19 years
In terms of unemployment among ages 16 to 19 years, the demographic groups most similar to Swiss are Sudanese (15.8%, a difference of 0.10%), Thai (15.7%, a difference of 0.11%), Somali (15.7%, a difference of 0.35%), Immigrants from Taiwan (15.8%, a difference of 0.42%), and German (15.7%, a difference of 0.56%).
| Demographics | Rating | Rank | Unemployment Among Ages 16 to 19 years |
| Taiwanese | 100.0 /100 | #12 | Exceptional 15.5% |
| Immigrants | Burma/Myanmar | 100.0 /100 | #13 | Exceptional 15.6% |
| Immigrants | Zaire | 100.0 /100 | #14 | Exceptional 15.6% |
| Yugoslavians | 100.0 /100 | #15 | Exceptional 15.6% |
| Germans | 100.0 /100 | #16 | Exceptional 15.7% |
| Somalis | 100.0 /100 | #17 | Exceptional 15.7% |
| Thais | 100.0 /100 | #18 | Exceptional 15.7% |
| Swiss | 100.0 /100 | #19 | Exceptional 15.8% |
| Sudanese | 100.0 /100 | #20 | Exceptional 15.8% |
| Immigrants | Taiwan | 100.0 /100 | #21 | Exceptional 15.8% |
| Finns | 100.0 /100 | #22 | Exceptional 15.9% |
| Belgians | 100.0 /100 | #23 | Exceptional 15.9% |
| Tongans | 100.0 /100 | #24 | Exceptional 15.9% |
| Filipinos | 100.0 /100 | #25 | Exceptional 15.9% |
| Dutch | 100.0 /100 | #26 | Exceptional 15.9% |