Hawaiian vs Immigrants from Nigeria Unemployment Among Ages 55 to 59 years
COMPARE
Hawaiian
Immigrants from Nigeria
Unemployment Among Ages 55 to 59 years
Unemployment Among Ages 55 to 59 years Comparison
Hawaiians
Immigrants from Nigeria
4.9%
UNEMPLOYMENT AMONG AGES 55 TO 59 YEARS
12.8/ 100
METRIC RATING
211th/ 347
METRIC RANK
4.9%
UNEMPLOYMENT AMONG AGES 55 TO 59 YEARS
8.0/ 100
METRIC RATING
219th/ 347
METRIC RANK
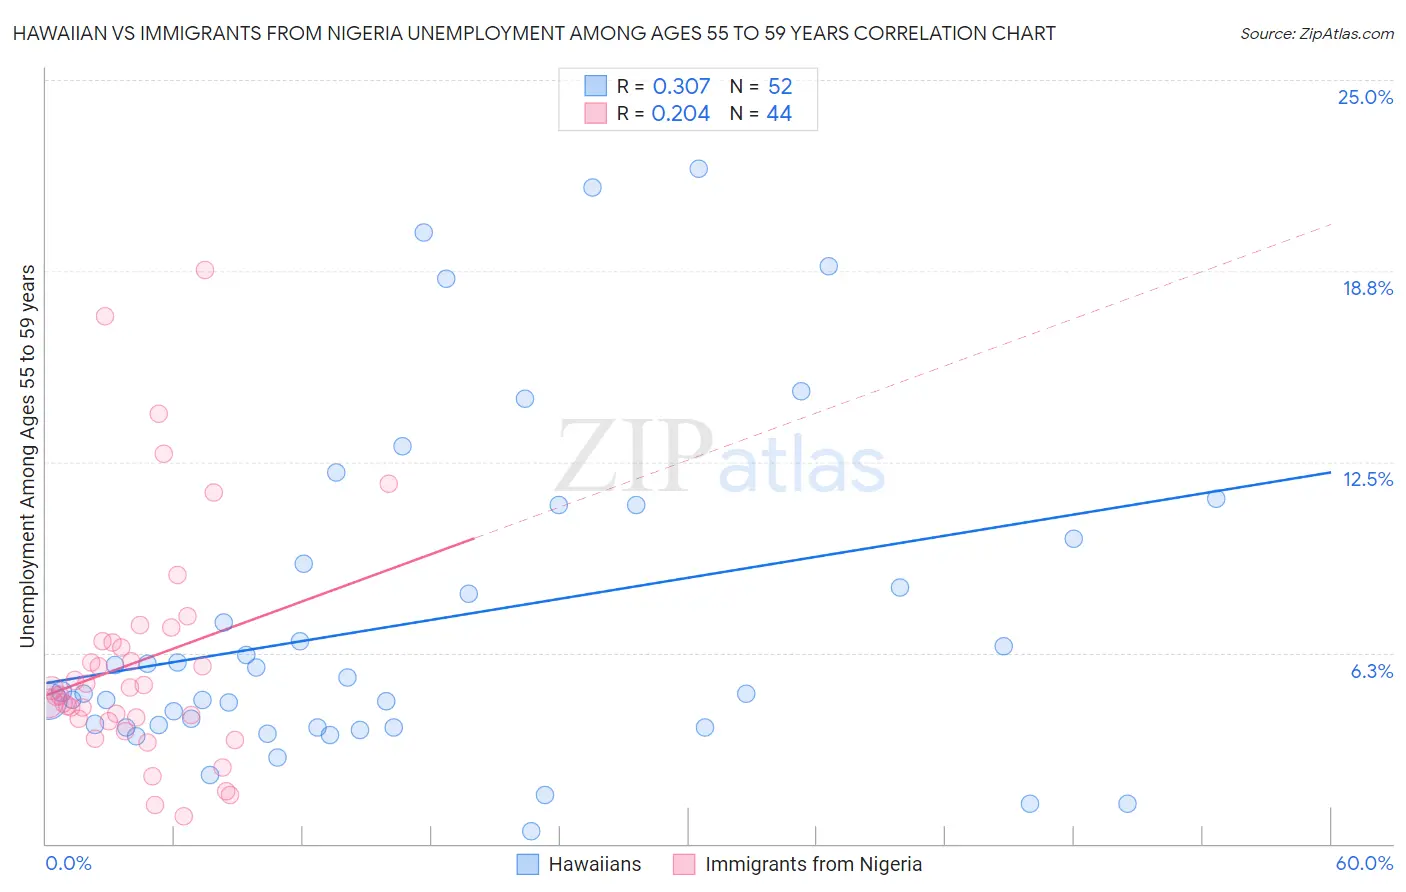
Hawaiian vs Immigrants from Nigeria Unemployment Among Ages 55 to 59 years Correlation Chart
The statistical analysis conducted on geographies consisting of 307,036,959 people shows a mild positive correlation between the proportion of Hawaiians and unemployment rate among population between the ages 55 and 59 in the United States with a correlation coefficient (R) of 0.307 and weighted average of 4.9%. Similarly, the statistical analysis conducted on geographies consisting of 271,157,168 people shows a weak positive correlation between the proportion of Immigrants from Nigeria and unemployment rate among population between the ages 55 and 59 in the United States with a correlation coefficient (R) of 0.204 and weighted average of 4.9%, a difference of 0.53%.
Unemployment Among Ages 55 to 59 years Correlation Summary
| Measurement | Hawaiian | Immigrants from Nigeria |
| Minimum | 0.40% | 0.90% |
| Maximum | 22.1% | 18.8% |
| Range | 21.7% | 17.9% |
| Mean | 7.3% | 6.0% |
| Median | 5.0% | 5.0% |
| Interquartile 25% (IQ1) | 3.8% | 4.0% |
| Interquartile 75% (IQ3) | 9.6% | 6.6% |
| Interquartile Range (IQR) | 5.8% | 2.6% |
| Standard Deviation (Sample) | 5.4% | 3.9% |
| Standard Deviation (Population) | 5.3% | 3.8% |
Demographics Similar to Hawaiians and Immigrants from Nigeria by Unemployment Among Ages 55 to 59 years
In terms of unemployment among ages 55 to 59 years, the demographic groups most similar to Hawaiians are Creek (4.9%, a difference of 0.010%), Immigrants from Haiti (4.9%, a difference of 0.040%), Immigrants from Kazakhstan (4.9%, a difference of 0.10%), Immigrants from Belarus (4.9%, a difference of 0.11%), and Immigrants from Australia (4.9%, a difference of 0.11%). Similarly, the demographic groups most similar to Immigrants from Nigeria are Immigrants from Austria (4.9%, a difference of 0.0%), Immigrants from Brazil (4.9%, a difference of 0.010%), Spanish American (4.9%, a difference of 0.020%), Indian (Asian) (4.9%, a difference of 0.060%), and Nigerian (4.9%, a difference of 0.060%).
| Demographics | Rating | Rank | Unemployment Among Ages 55 to 59 years |
| Haitians | 18.1 /100 | #205 | Poor 4.9% |
| Immigrants | Belarus | 14.1 /100 | #206 | Poor 4.9% |
| Immigrants | Australia | 14.1 /100 | #207 | Poor 4.9% |
| Immigrants | Kazakhstan | 14.0 /100 | #208 | Poor 4.9% |
| Immigrants | Haiti | 13.3 /100 | #209 | Poor 4.9% |
| Creek | 12.9 /100 | #210 | Poor 4.9% |
| Hawaiians | 12.8 /100 | #211 | Poor 4.9% |
| Immigrants | Nonimmigrants | 11.2 /100 | #212 | Poor 4.9% |
| Bermudans | 11.0 /100 | #213 | Poor 4.9% |
| Immigrants | Denmark | 10.3 /100 | #214 | Poor 4.9% |
| Syrians | 8.6 /100 | #215 | Tragic 4.9% |
| Spanish Americans | 8.1 /100 | #216 | Tragic 4.9% |
| Immigrants | Brazil | 8.1 /100 | #217 | Tragic 4.9% |
| Immigrants | Austria | 8.0 /100 | #218 | Tragic 4.9% |
| Immigrants | Nigeria | 8.0 /100 | #219 | Tragic 4.9% |
| Indians (Asian) | 7.6 /100 | #220 | Tragic 4.9% |
| Nigerians | 7.5 /100 | #221 | Tragic 4.9% |
| Spanish | 5.1 /100 | #222 | Tragic 5.0% |
| Immigrants | Ireland | 4.8 /100 | #223 | Tragic 5.0% |
| Sub-Saharan Africans | 4.4 /100 | #224 | Tragic 5.0% |
| Costa Ricans | 4.4 /100 | #225 | Tragic 5.0% |