Haitian vs Trinidadian and Tobagonian Unemployment Among Youth under 25 years
COMPARE
Haitian
Trinidadian and Tobagonian
Unemployment Among Youth under 25 years
Unemployment Among Youth under 25 years Comparison
Haitians
Trinidadians and Tobagonians
13.9%
UNEMPLOYMENT AMONG YOUTH UNDER 25 YEARS
0.0/ 100
METRIC RATING
305th/ 347
METRIC RANK
14.6%
UNEMPLOYMENT AMONG YOUTH UNDER 25 YEARS
0.0/ 100
METRIC RATING
322nd/ 347
METRIC RANK
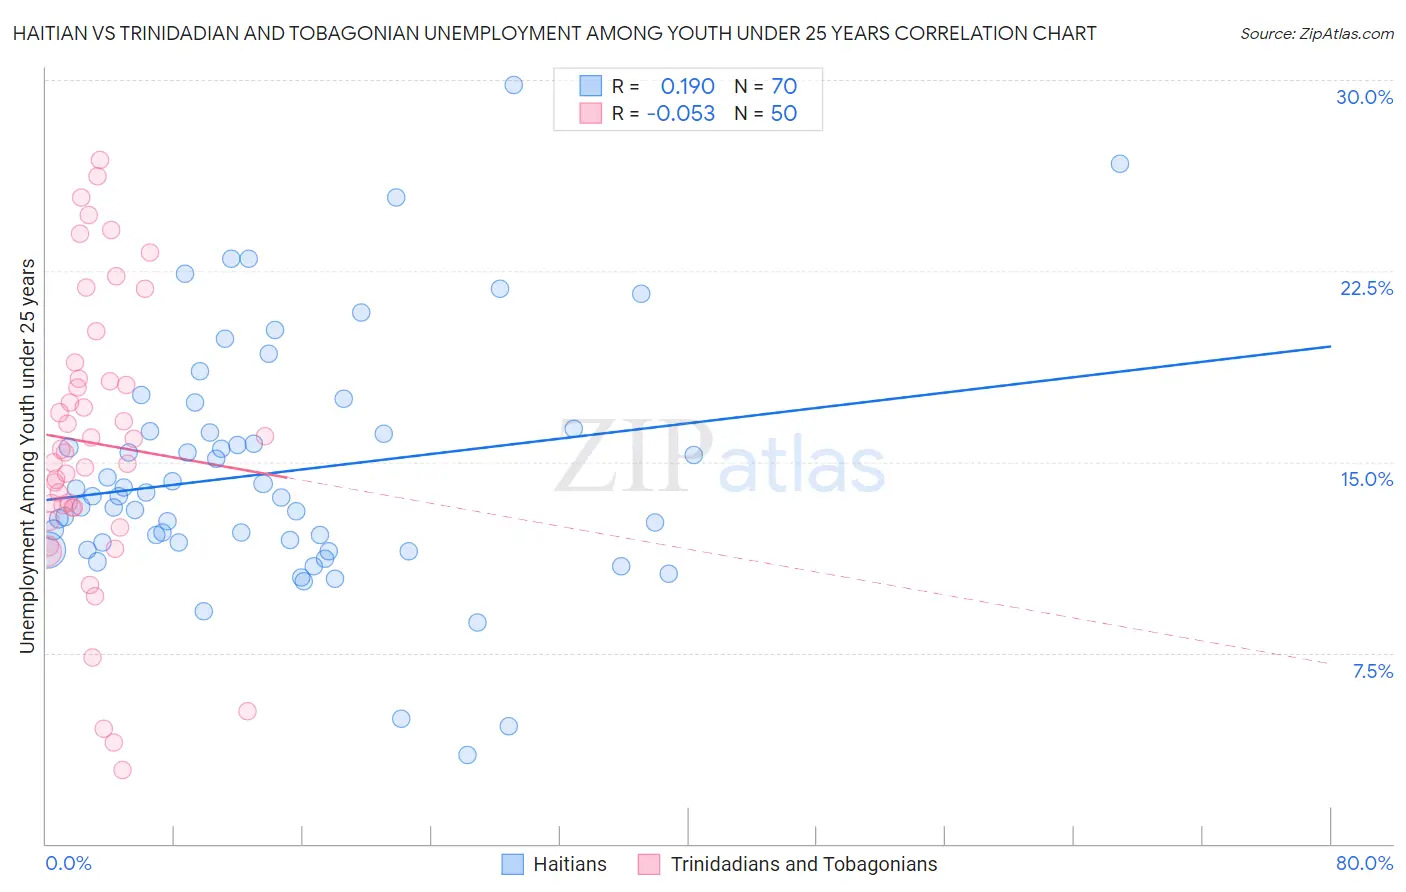
Haitian vs Trinidadian and Tobagonian Unemployment Among Youth under 25 years Correlation Chart
The statistical analysis conducted on geographies consisting of 285,776,901 people shows a poor positive correlation between the proportion of Haitians and unemployment rate among youth under the age of 25 in the United States with a correlation coefficient (R) of 0.190 and weighted average of 13.9%. Similarly, the statistical analysis conducted on geographies consisting of 218,912,692 people shows a slight negative correlation between the proportion of Trinidadians and Tobagonians and unemployment rate among youth under the age of 25 in the United States with a correlation coefficient (R) of -0.053 and weighted average of 14.6%, a difference of 5.4%.
Unemployment Among Youth under 25 years Correlation Summary
| Measurement | Haitian | Trinidadian and Tobagonian |
| Minimum | 3.5% | 2.9% |
| Maximum | 29.8% | 26.9% |
| Range | 26.3% | 24.0% |
| Mean | 14.6% | 15.7% |
| Median | 13.7% | 15.4% |
| Interquartile 25% (IQ1) | 11.8% | 13.2% |
| Interquartile 75% (IQ3) | 16.2% | 18.3% |
| Interquartile Range (IQR) | 4.4% | 5.1% |
| Standard Deviation (Sample) | 4.8% | 5.7% |
| Standard Deviation (Population) | 4.8% | 5.6% |
Demographics Similar to Haitians and Trinidadians and Tobagonians by Unemployment Among Youth under 25 years
In terms of unemployment among youth under 25 years, the demographic groups most similar to Haitians are Pueblo (13.9%, a difference of 0.070%), Belizean (13.8%, a difference of 0.33%), Houma (13.8%, a difference of 0.33%), Immigrants from Haiti (14.0%, a difference of 0.56%), and Immigrants from Belize (14.0%, a difference of 0.94%). Similarly, the demographic groups most similar to Trinidadians and Tobagonians are Cheyenne (14.6%, a difference of 0.070%), Immigrants from Trinidad and Tobago (14.6%, a difference of 0.090%), Barbadian (14.6%, a difference of 0.23%), West Indian (14.6%, a difference of 0.27%), and Immigrants from Dominica (14.6%, a difference of 0.31%).
| Demographics | Rating | Rank | Unemployment Among Youth under 25 years |
| Belizeans | 0.0 /100 | #303 | Tragic 13.8% |
| Houma | 0.0 /100 | #304 | Tragic 13.8% |
| Haitians | 0.0 /100 | #305 | Tragic 13.9% |
| Pueblo | 0.0 /100 | #306 | Tragic 13.9% |
| Immigrants | Haiti | 0.0 /100 | #307 | Tragic 14.0% |
| Immigrants | Belize | 0.0 /100 | #308 | Tragic 14.0% |
| Aleuts | 0.0 /100 | #309 | Tragic 14.1% |
| Immigrants | West Indies | 0.0 /100 | #310 | Tragic 14.2% |
| Immigrants | Bangladesh | 0.0 /100 | #311 | Tragic 14.2% |
| Vietnamese | 0.0 /100 | #312 | Tragic 14.3% |
| Immigrants | Armenia | 0.0 /100 | #313 | Tragic 14.4% |
| Jamaicans | 0.0 /100 | #314 | Tragic 14.4% |
| Sioux | 0.0 /100 | #315 | Tragic 14.4% |
| Natives/Alaskans | 0.0 /100 | #316 | Tragic 14.5% |
| Blacks/African Americans | 0.0 /100 | #317 | Tragic 14.5% |
| Immigrants | Dominica | 0.0 /100 | #318 | Tragic 14.6% |
| West Indians | 0.0 /100 | #319 | Tragic 14.6% |
| Barbadians | 0.0 /100 | #320 | Tragic 14.6% |
| Cheyenne | 0.0 /100 | #321 | Tragic 14.6% |
| Trinidadians and Tobagonians | 0.0 /100 | #322 | Tragic 14.6% |
| Immigrants | Trinidad and Tobago | 0.0 /100 | #323 | Tragic 14.6% |