Guamanian/Chamorro vs Immigrants from Ecuador Unemployment Among Ages 16 to 19 years
COMPARE
Guamanian/Chamorro
Immigrants from Ecuador
Unemployment Among Ages 16 to 19 years
Unemployment Among Ages 16 to 19 years Comparison
Guamanians/Chamorros
Immigrants from Ecuador
17.9%
UNEMPLOYMENT AMONG AGES 16 TO 19 YEARS
14.5/ 100
METRIC RATING
211th/ 347
METRIC RANK
20.9%
UNEMPLOYMENT AMONG AGES 16 TO 19 YEARS
0.0/ 100
METRIC RATING
301st/ 347
METRIC RANK
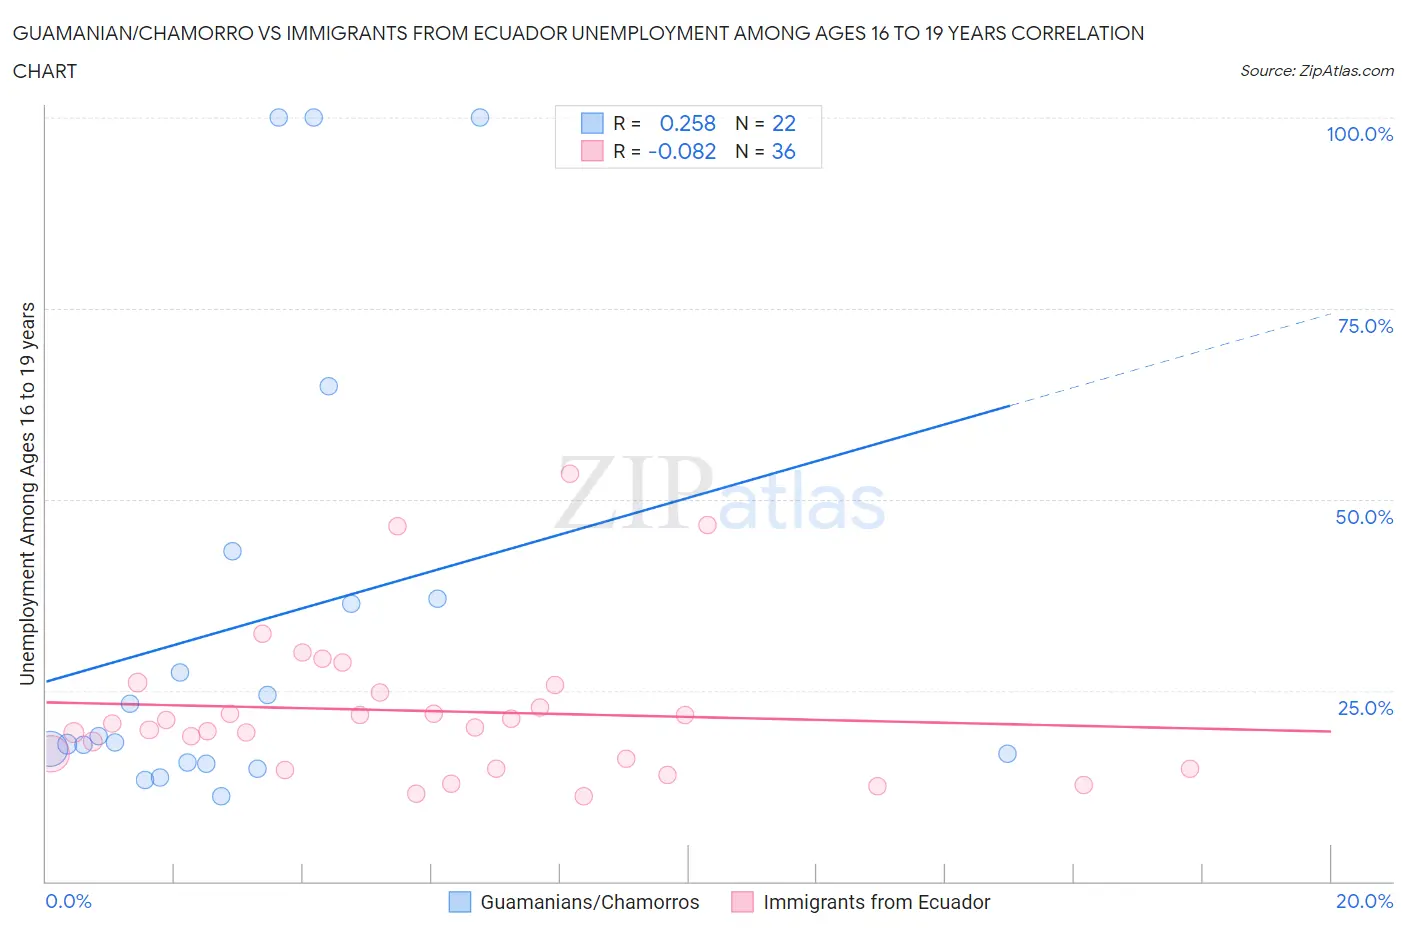
Guamanian/Chamorro vs Immigrants from Ecuador Unemployment Among Ages 16 to 19 years Correlation Chart
The statistical analysis conducted on geographies consisting of 216,501,963 people shows a weak positive correlation between the proportion of Guamanians/Chamorros and unemployment rate among population between the ages 16 and 19 in the United States with a correlation coefficient (R) of 0.258 and weighted average of 17.9%. Similarly, the statistical analysis conducted on geographies consisting of 261,412,361 people shows a slight negative correlation between the proportion of Immigrants from Ecuador and unemployment rate among population between the ages 16 and 19 in the United States with a correlation coefficient (R) of -0.082 and weighted average of 20.9%, a difference of 16.3%.
Unemployment Among Ages 16 to 19 years Correlation Summary
| Measurement | Guamanian/Chamorro | Immigrants from Ecuador |
| Minimum | 11.1% | 11.1% |
| Maximum | 100.0% | 53.4% |
| Range | 88.9% | 42.3% |
| Mean | 33.9% | 22.3% |
| Median | 18.6% | 20.4% |
| Interquartile 25% (IQ1) | 15.6% | 15.4% |
| Interquartile 75% (IQ3) | 37.0% | 25.2% |
| Interquartile Range (IQR) | 21.4% | 9.8% |
| Standard Deviation (Sample) | 29.6% | 9.8% |
| Standard Deviation (Population) | 28.9% | 9.6% |
Similar Demographics by Unemployment Among Ages 16 to 19 years
Demographics Similar to Guamanians/Chamorros by Unemployment Among Ages 16 to 19 years
In terms of unemployment among ages 16 to 19 years, the demographic groups most similar to Guamanians/Chamorros are Argentinean (18.0%, a difference of 0.060%), Chippewa (18.0%, a difference of 0.070%), Immigrants from Morocco (18.0%, a difference of 0.090%), Carpatho Rusyn (17.9%, a difference of 0.10%), and Immigrants from Syria (18.0%, a difference of 0.11%).
| Demographics | Rating | Rank | Unemployment Among Ages 16 to 19 years |
| Immigrants | Nonimmigrants | 20.9 /100 | #204 | Fair 17.9% |
| Assyrians/Chaldeans/Syriacs | 20.8 /100 | #205 | Fair 17.9% |
| Immigrants | Southern Europe | 18.9 /100 | #206 | Poor 17.9% |
| Liberians | 18.6 /100 | #207 | Poor 17.9% |
| Hawaiians | 16.8 /100 | #208 | Poor 17.9% |
| Cherokee | 15.7 /100 | #209 | Poor 17.9% |
| Carpatho Rusyns | 15.6 /100 | #210 | Poor 17.9% |
| Guamanians/Chamorros | 14.5 /100 | #211 | Poor 17.9% |
| Argentineans | 13.8 /100 | #212 | Poor 18.0% |
| Chippewa | 13.7 /100 | #213 | Poor 18.0% |
| Immigrants | Morocco | 13.5 /100 | #214 | Poor 18.0% |
| Immigrants | Syria | 13.3 /100 | #215 | Poor 18.0% |
| Immigrants | Kazakhstan | 13.0 /100 | #216 | Poor 18.0% |
| South American Indians | 13.0 /100 | #217 | Poor 18.0% |
| Immigrants | Argentina | 12.5 /100 | #218 | Poor 18.0% |
Demographics Similar to Immigrants from Ecuador by Unemployment Among Ages 16 to 19 years
In terms of unemployment among ages 16 to 19 years, the demographic groups most similar to Immigrants from Ecuador are Immigrants from Caribbean (20.9%, a difference of 0.11%), Senegalese (21.0%, a difference of 0.49%), Aleut (21.2%, a difference of 1.4%), Immigrants from Senegal (21.2%, a difference of 1.5%), and Ecuadorian (20.5%, a difference of 1.6%).
| Demographics | Rating | Rank | Unemployment Among Ages 16 to 19 years |
| Immigrants | Haiti | 0.0 /100 | #294 | Tragic 20.4% |
| Central American Indians | 0.0 /100 | #295 | Tragic 20.4% |
| Armenians | 0.0 /100 | #296 | Tragic 20.5% |
| Alsatians | 0.0 /100 | #297 | Tragic 20.5% |
| Haitians | 0.0 /100 | #298 | Tragic 20.5% |
| Immigrants | Uzbekistan | 0.0 /100 | #299 | Tragic 20.5% |
| Ecuadorians | 0.0 /100 | #300 | Tragic 20.5% |
| Immigrants | Ecuador | 0.0 /100 | #301 | Tragic 20.9% |
| Immigrants | Caribbean | 0.0 /100 | #302 | Tragic 20.9% |
| Senegalese | 0.0 /100 | #303 | Tragic 21.0% |
| Aleuts | 0.0 /100 | #304 | Tragic 21.2% |
| Immigrants | Senegal | 0.0 /100 | #305 | Tragic 21.2% |
| U.S. Virgin Islanders | 0.0 /100 | #306 | Tragic 21.3% |
| Blacks/African Americans | 0.0 /100 | #307 | Tragic 21.4% |
| Immigrants | Bangladesh | 0.0 /100 | #308 | Tragic 21.5% |