Greek vs Spanish American Unemployment Among Ages 20 to 24 years
COMPARE
Greek
Spanish American
Unemployment Among Ages 20 to 24 years
Unemployment Among Ages 20 to 24 years Comparison
Greeks
Spanish Americans
10.4%
UNEMPLOYMENT AMONG AGES 20 TO 24 YEARS
37.2/ 100
METRIC RATING
184th/ 347
METRIC RANK
10.8%
UNEMPLOYMENT AMONG AGES 20 TO 24 YEARS
0.4/ 100
METRIC RATING
253rd/ 347
METRIC RANK
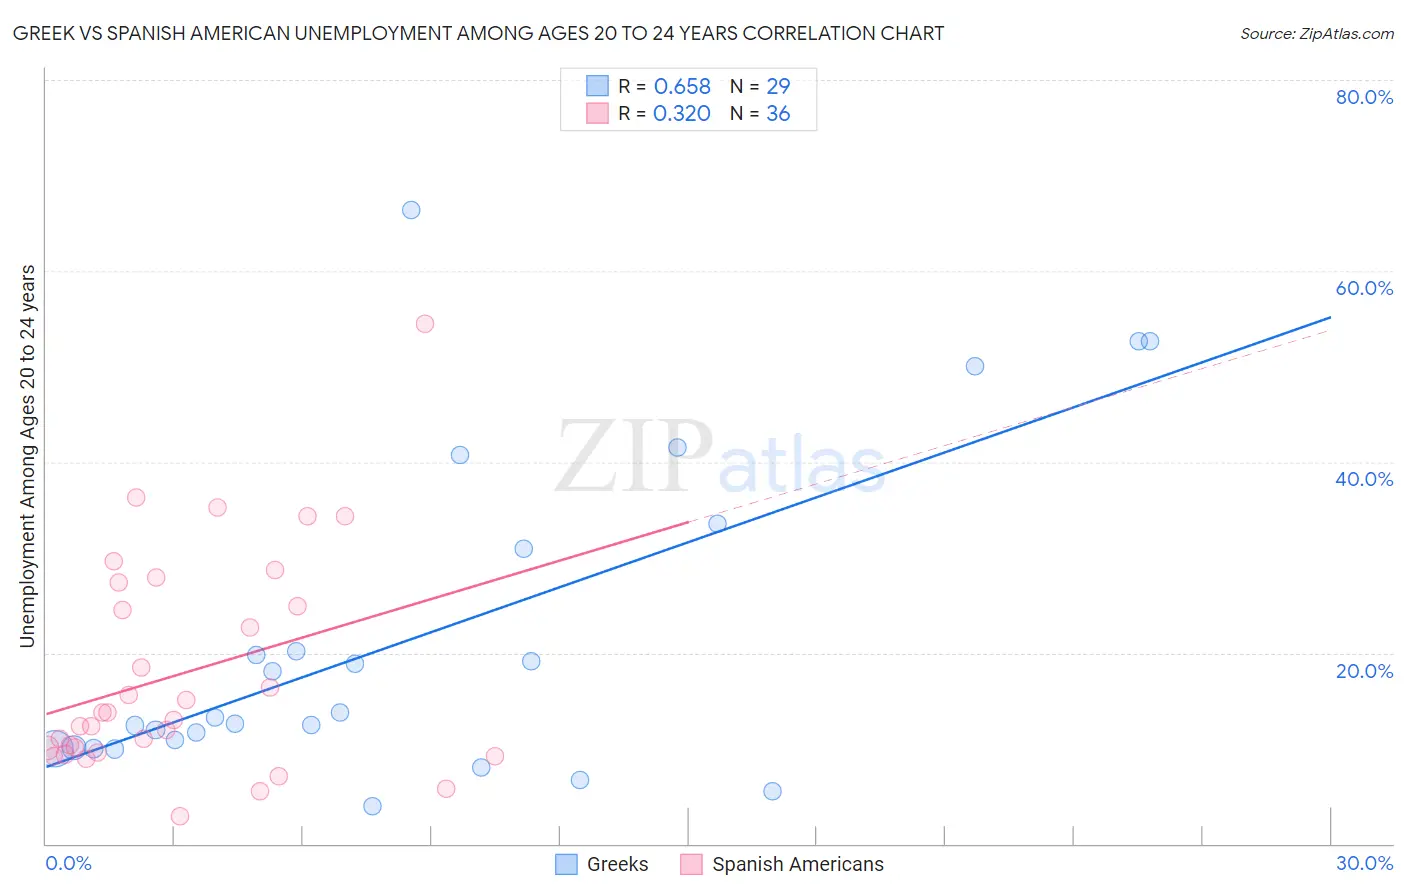
Greek vs Spanish American Unemployment Among Ages 20 to 24 years Correlation Chart
The statistical analysis conducted on geographies consisting of 459,033,350 people shows a significant positive correlation between the proportion of Greeks and unemployment rate among population between the ages 20 and 24 in the United States with a correlation coefficient (R) of 0.658 and weighted average of 10.4%. Similarly, the statistical analysis conducted on geographies consisting of 102,247,222 people shows a mild positive correlation between the proportion of Spanish Americans and unemployment rate among population between the ages 20 and 24 in the United States with a correlation coefficient (R) of 0.320 and weighted average of 10.8%, a difference of 4.6%.
Unemployment Among Ages 20 to 24 years Correlation Summary
| Measurement | Greek | Spanish American |
| Minimum | 3.9% | 2.9% |
| Maximum | 66.4% | 54.5% |
| Range | 62.5% | 51.6% |
| Mean | 21.6% | 17.8% |
| Median | 13.2% | 13.3% |
| Interquartile 25% (IQ1) | 10.0% | 9.8% |
| Interquartile 75% (IQ3) | 32.2% | 26.1% |
| Interquartile Range (IQR) | 22.2% | 16.3% |
| Standard Deviation (Sample) | 16.9% | 11.4% |
| Standard Deviation (Population) | 16.6% | 11.2% |
Similar Demographics by Unemployment Among Ages 20 to 24 years
Demographics Similar to Greeks by Unemployment Among Ages 20 to 24 years
In terms of unemployment among ages 20 to 24 years, the demographic groups most similar to Greeks are Immigrants from Egypt (10.4%, a difference of 0.010%), Immigrants from Germany (10.4%, a difference of 0.040%), Syrian (10.4%, a difference of 0.060%), Okinawan (10.3%, a difference of 0.070%), and Guamanian/Chamorro (10.4%, a difference of 0.070%).
| Demographics | Rating | Rank | Unemployment Among Ages 20 to 24 years |
| Immigrants | Czechoslovakia | 40.8 /100 | #177 | Average 10.3% |
| Alsatians | 40.5 /100 | #178 | Average 10.3% |
| Tlingit-Haida | 39.7 /100 | #179 | Fair 10.3% |
| Immigrants | Turkey | 39.3 /100 | #180 | Fair 10.3% |
| Okinawans | 39.1 /100 | #181 | Fair 10.3% |
| Immigrants | Germany | 38.1 /100 | #182 | Fair 10.4% |
| Immigrants | Egypt | 37.4 /100 | #183 | Fair 10.4% |
| Greeks | 37.2 /100 | #184 | Fair 10.4% |
| Syrians | 35.6 /100 | #185 | Fair 10.4% |
| Guamanians/Chamorros | 35.4 /100 | #186 | Fair 10.4% |
| Immigrants | Western Europe | 35.0 /100 | #187 | Fair 10.4% |
| Immigrants | Russia | 34.6 /100 | #188 | Fair 10.4% |
| Hawaiians | 33.9 /100 | #189 | Fair 10.4% |
| Immigrants | China | 32.6 /100 | #190 | Fair 10.4% |
| Immigrants | Eastern Europe | 25.8 /100 | #191 | Fair 10.4% |
Demographics Similar to Spanish Americans by Unemployment Among Ages 20 to 24 years
In terms of unemployment among ages 20 to 24 years, the demographic groups most similar to Spanish Americans are Immigrants from Syria (10.8%, a difference of 0.050%), Liberian (10.8%, a difference of 0.11%), Immigrants from Panama (10.8%, a difference of 0.12%), Immigrants from Israel (10.8%, a difference of 0.12%), and Albanian (10.8%, a difference of 0.18%).
| Demographics | Rating | Rank | Unemployment Among Ages 20 to 24 years |
| Immigrants | Iran | 0.9 /100 | #246 | Tragic 10.8% |
| Immigrants | Albania | 0.7 /100 | #247 | Tragic 10.8% |
| Cree | 0.6 /100 | #248 | Tragic 10.8% |
| South American Indians | 0.5 /100 | #249 | Tragic 10.8% |
| Albanians | 0.5 /100 | #250 | Tragic 10.8% |
| Immigrants | Panama | 0.4 /100 | #251 | Tragic 10.8% |
| Immigrants | Syria | 0.4 /100 | #252 | Tragic 10.8% |
| Spanish Americans | 0.4 /100 | #253 | Tragic 10.8% |
| Liberians | 0.3 /100 | #254 | Tragic 10.8% |
| Immigrants | Israel | 0.3 /100 | #255 | Tragic 10.8% |
| Immigrants | Bahamas | 0.3 /100 | #256 | Tragic 10.9% |
| Immigrants | Western Asia | 0.3 /100 | #257 | Tragic 10.9% |
| Dutch West Indians | 0.3 /100 | #258 | Tragic 10.9% |
| Panamanians | 0.2 /100 | #259 | Tragic 10.9% |
| Immigrants | Lebanon | 0.2 /100 | #260 | Tragic 10.9% |