Greek vs Immigrants from Bahamas Unemployment Among Ages 55 to 59 years
COMPARE
Greek
Immigrants from Bahamas
Unemployment Among Ages 55 to 59 years
Unemployment Among Ages 55 to 59 years Comparison
Greeks
Immigrants from Bahamas
4.7%
UNEMPLOYMENT AMONG AGES 55 TO 59 YEARS
86.6/ 100
METRIC RATING
130th/ 347
METRIC RANK
4.8%
UNEMPLOYMENT AMONG AGES 55 TO 59 YEARS
71.8/ 100
METRIC RATING
148th/ 347
METRIC RANK
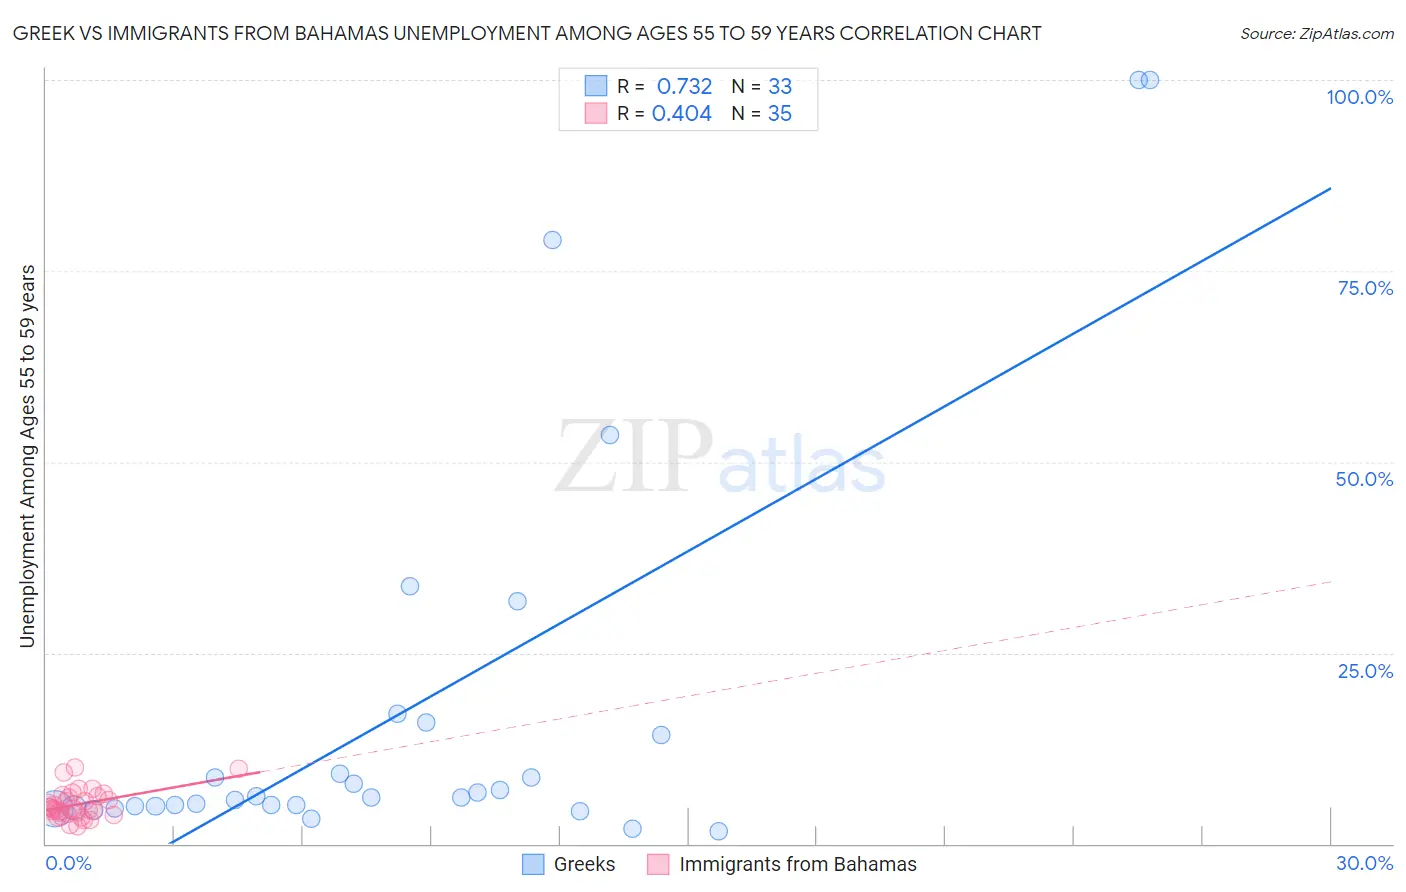
Greek vs Immigrants from Bahamas Unemployment Among Ages 55 to 59 years Correlation Chart
The statistical analysis conducted on geographies consisting of 434,996,960 people shows a strong positive correlation between the proportion of Greeks and unemployment rate among population between the ages 55 and 59 in the United States with a correlation coefficient (R) of 0.732 and weighted average of 4.7%. Similarly, the statistical analysis conducted on geographies consisting of 102,294,288 people shows a moderate positive correlation between the proportion of Immigrants from Bahamas and unemployment rate among population between the ages 55 and 59 in the United States with a correlation coefficient (R) of 0.404 and weighted average of 4.8%, a difference of 0.97%.
Unemployment Among Ages 55 to 59 years Correlation Summary
| Measurement | Greek | Immigrants from Bahamas |
| Minimum | 1.7% | 2.2% |
| Maximum | 100.0% | 10.0% |
| Range | 98.3% | 7.8% |
| Mean | 17.5% | 5.1% |
| Median | 6.1% | 4.6% |
| Interquartile 25% (IQ1) | 4.8% | 3.9% |
| Interquartile 75% (IQ3) | 15.1% | 6.3% |
| Interquartile Range (IQR) | 10.3% | 2.4% |
| Standard Deviation (Sample) | 26.6% | 1.9% |
| Standard Deviation (Population) | 26.2% | 1.9% |
Demographics Similar to Greeks and Immigrants from Bahamas by Unemployment Among Ages 55 to 59 years
In terms of unemployment among ages 55 to 59 years, the demographic groups most similar to Greeks are Immigrants from Sweden (4.7%, a difference of 0.010%), Immigrants from Thailand (4.7%, a difference of 0.11%), Immigrants from Romania (4.7%, a difference of 0.12%), Immigrants from Netherlands (4.7%, a difference of 0.18%), and Panamanian (4.7%, a difference of 0.21%). Similarly, the demographic groups most similar to Immigrants from Bahamas are Immigrants from Lithuania (4.8%, a difference of 0.050%), Immigrants from Singapore (4.8%, a difference of 0.26%), Immigrants from Northern Europe (4.8%, a difference of 0.31%), Immigrants from South Eastern Asia (4.8%, a difference of 0.31%), and Immigrants from Asia (4.8%, a difference of 0.33%).
| Demographics | Rating | Rank | Unemployment Among Ages 55 to 59 years |
| Immigrants | Sweden | 86.8 /100 | #129 | Excellent 4.7% |
| Greeks | 86.6 /100 | #130 | Excellent 4.7% |
| Immigrants | Thailand | 85.4 /100 | #131 | Excellent 4.7% |
| Immigrants | Romania | 85.3 /100 | #132 | Excellent 4.7% |
| Immigrants | Netherlands | 84.5 /100 | #133 | Excellent 4.7% |
| Panamanians | 84.1 /100 | #134 | Excellent 4.7% |
| Slavs | 83.7 /100 | #135 | Excellent 4.7% |
| Colombians | 83.6 /100 | #136 | Excellent 4.7% |
| Delaware | 83.6 /100 | #137 | Excellent 4.7% |
| Immigrants | Switzerland | 82.9 /100 | #138 | Excellent 4.7% |
| Romanians | 82.7 /100 | #139 | Excellent 4.7% |
| Immigrants | Indonesia | 80.2 /100 | #140 | Excellent 4.8% |
| French Canadians | 80.1 /100 | #141 | Excellent 4.8% |
| Immigrants | Norway | 79.8 /100 | #142 | Good 4.8% |
| Ukrainians | 78.6 /100 | #143 | Good 4.8% |
| Immigrants | Asia | 77.8 /100 | #144 | Good 4.8% |
| Immigrants | Northern Europe | 77.5 /100 | #145 | Good 4.8% |
| Immigrants | South Eastern Asia | 77.4 /100 | #146 | Good 4.8% |
| Immigrants | Singapore | 76.6 /100 | #147 | Good 4.8% |
| Immigrants | Bahamas | 71.8 /100 | #148 | Good 4.8% |
| Immigrants | Lithuania | 70.8 /100 | #149 | Good 4.8% |