Ghanaian vs Immigrants from Sri Lanka Unemployment Among Women with Children Under 18 years
COMPARE
Ghanaian
Immigrants from Sri Lanka
Unemployment Among Women with Children Under 18 years
Unemployment Among Women with Children Under 18 years Comparison
Ghanaians
Immigrants from Sri Lanka
6.2%
UNEMPLOYMENT AMONG WOMEN WITH CHILDREN UNDER 18 YEARS
0.1/ 100
METRIC RATING
270th/ 347
METRIC RANK
5.1%
UNEMPLOYMENT AMONG WOMEN WITH CHILDREN UNDER 18 YEARS
98.1/ 100
METRIC RATING
55th/ 347
METRIC RANK
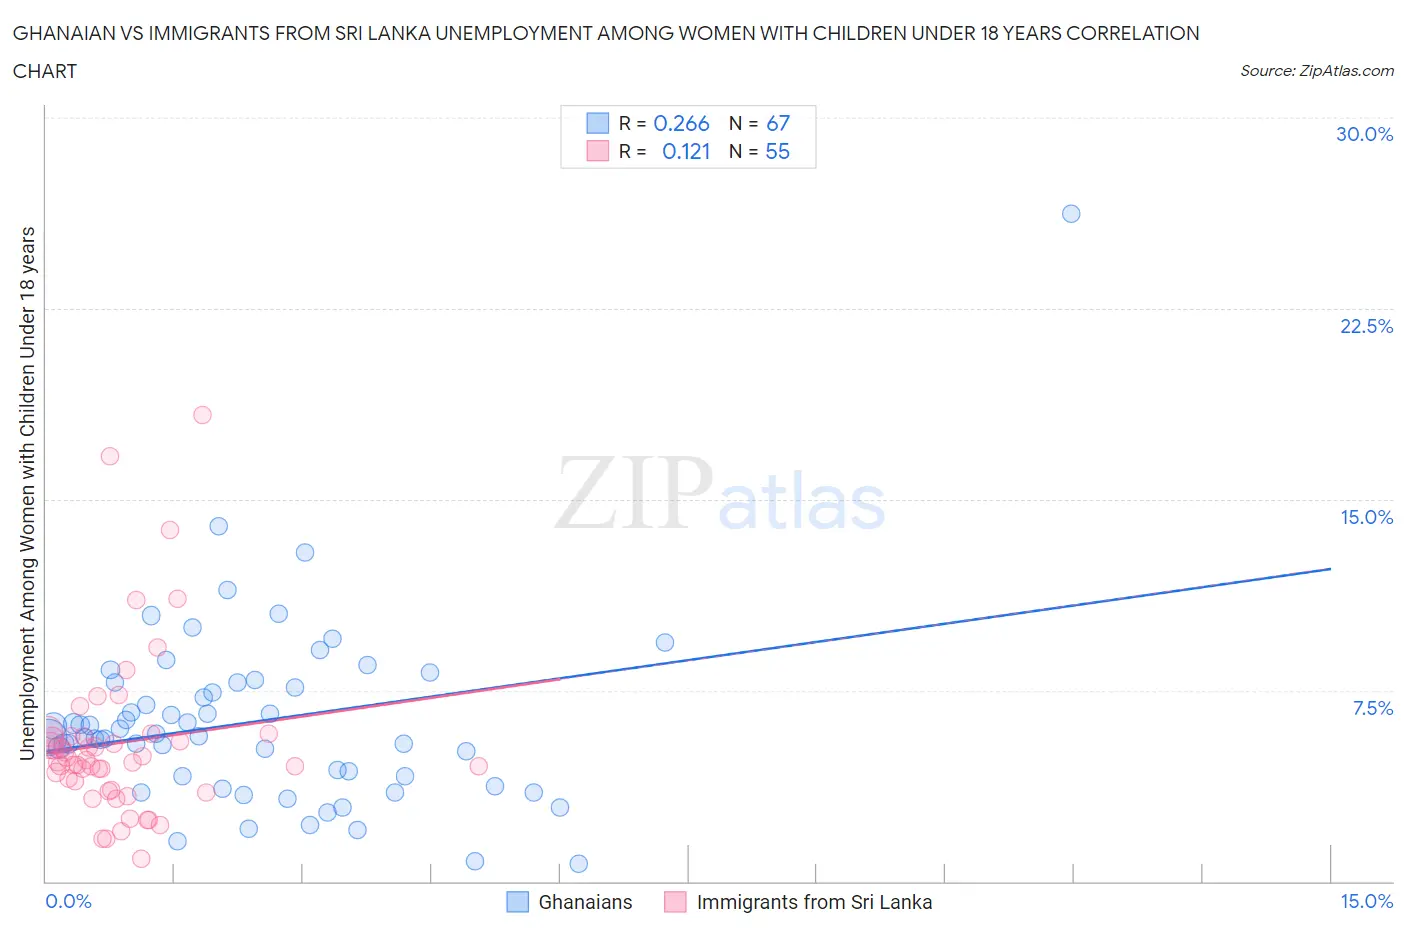
Ghanaian vs Immigrants from Sri Lanka Unemployment Among Women with Children Under 18 years Correlation Chart
The statistical analysis conducted on geographies consisting of 187,971,205 people shows a weak positive correlation between the proportion of Ghanaians and unemployment rate among women with children under the age of 18 in the United States with a correlation coefficient (R) of 0.266 and weighted average of 6.2%. Similarly, the statistical analysis conducted on geographies consisting of 148,034,106 people shows a poor positive correlation between the proportion of Immigrants from Sri Lanka and unemployment rate among women with children under the age of 18 in the United States with a correlation coefficient (R) of 0.121 and weighted average of 5.1%, a difference of 21.9%.
Unemployment Among Women with Children Under 18 years Correlation Summary
| Measurement | Ghanaian | Immigrants from Sri Lanka |
| Minimum | 0.70% | 0.90% |
| Maximum | 26.2% | 18.3% |
| Range | 25.5% | 17.4% |
| Mean | 6.3% | 5.4% |
| Median | 5.7% | 4.7% |
| Interquartile 25% (IQ1) | 4.1% | 3.6% |
| Interquartile 75% (IQ3) | 7.8% | 5.7% |
| Interquartile Range (IQR) | 3.7% | 2.1% |
| Standard Deviation (Sample) | 3.7% | 3.3% |
| Standard Deviation (Population) | 3.6% | 3.3% |
Similar Demographics by Unemployment Among Women with Children Under 18 years
Demographics Similar to Ghanaians by Unemployment Among Women with Children Under 18 years
In terms of unemployment among women with children under 18 years, the demographic groups most similar to Ghanaians are Cajun (6.2%, a difference of 0.0%), Trinidadian and Tobagonian (6.2%, a difference of 0.040%), French American Indian (6.2%, a difference of 0.060%), Subsaharan African (6.2%, a difference of 0.070%), and Central American (6.2%, a difference of 0.30%).
| Demographics | Rating | Rank | Unemployment Among Women with Children Under 18 years |
| Spanish American Indians | 0.1 /100 | #263 | Tragic 6.1% |
| Comanche | 0.1 /100 | #264 | Tragic 6.1% |
| Immigrants | Bahamas | 0.1 /100 | #265 | Tragic 6.1% |
| Sub-Saharan Africans | 0.1 /100 | #266 | Tragic 6.2% |
| French American Indians | 0.1 /100 | #267 | Tragic 6.2% |
| Trinidadians and Tobagonians | 0.1 /100 | #268 | Tragic 6.2% |
| Cajuns | 0.1 /100 | #269 | Tragic 6.2% |
| Ghanaians | 0.1 /100 | #270 | Tragic 6.2% |
| Central Americans | 0.0 /100 | #271 | Tragic 6.2% |
| Salvadorans | 0.0 /100 | #272 | Tragic 6.2% |
| Immigrants | Western Africa | 0.0 /100 | #273 | Tragic 6.2% |
| Senegalese | 0.0 /100 | #274 | Tragic 6.2% |
| Dutch West Indians | 0.0 /100 | #275 | Tragic 6.2% |
| Immigrants | Ghana | 0.0 /100 | #276 | Tragic 6.2% |
| Mexican American Indians | 0.0 /100 | #277 | Tragic 6.2% |
Demographics Similar to Immigrants from Sri Lanka by Unemployment Among Women with Children Under 18 years
In terms of unemployment among women with children under 18 years, the demographic groups most similar to Immigrants from Sri Lanka are Immigrants from Ireland (5.1%, a difference of 0.040%), Czechoslovakian (5.1%, a difference of 0.090%), Immigrants from Serbia (5.1%, a difference of 0.13%), Scottish (5.1%, a difference of 0.16%), and Immigrants from Belgium (5.1%, a difference of 0.18%).
| Demographics | Rating | Rank | Unemployment Among Women with Children Under 18 years |
| Northern Europeans | 98.6 /100 | #48 | Exceptional 5.0% |
| Lithuanians | 98.4 /100 | #49 | Exceptional 5.0% |
| Immigrants | Japan | 98.4 /100 | #50 | Exceptional 5.0% |
| Yugoslavians | 98.3 /100 | #51 | Exceptional 5.1% |
| Immigrants | Nepal | 98.3 /100 | #52 | Exceptional 5.1% |
| Scottish | 98.2 /100 | #53 | Exceptional 5.1% |
| Immigrants | Serbia | 98.2 /100 | #54 | Exceptional 5.1% |
| Immigrants | Sri Lanka | 98.1 /100 | #55 | Exceptional 5.1% |
| Immigrants | Ireland | 98.0 /100 | #56 | Exceptional 5.1% |
| Czechoslovakians | 98.0 /100 | #57 | Exceptional 5.1% |
| Immigrants | Belgium | 97.9 /100 | #58 | Exceptional 5.1% |
| Asians | 97.9 /100 | #59 | Exceptional 5.1% |
| Welsh | 97.7 /100 | #60 | Exceptional 5.1% |
| Russians | 97.5 /100 | #61 | Exceptional 5.1% |
| Immigrants | Bulgaria | 97.4 /100 | #62 | Exceptional 5.1% |