Ghanaian vs Immigrants from Colombia Unemployment Among Youth under 25 years
COMPARE
Ghanaian
Immigrants from Colombia
Unemployment Among Youth under 25 years
Unemployment Among Youth under 25 years Comparison
Ghanaians
Immigrants from Colombia
13.3%
UNEMPLOYMENT AMONG YOUTH UNDER 25 YEARS
0.0/ 100
METRIC RATING
285th/ 347
METRIC RANK
11.8%
UNEMPLOYMENT AMONG YOUTH UNDER 25 YEARS
20.9/ 100
METRIC RATING
199th/ 347
METRIC RANK
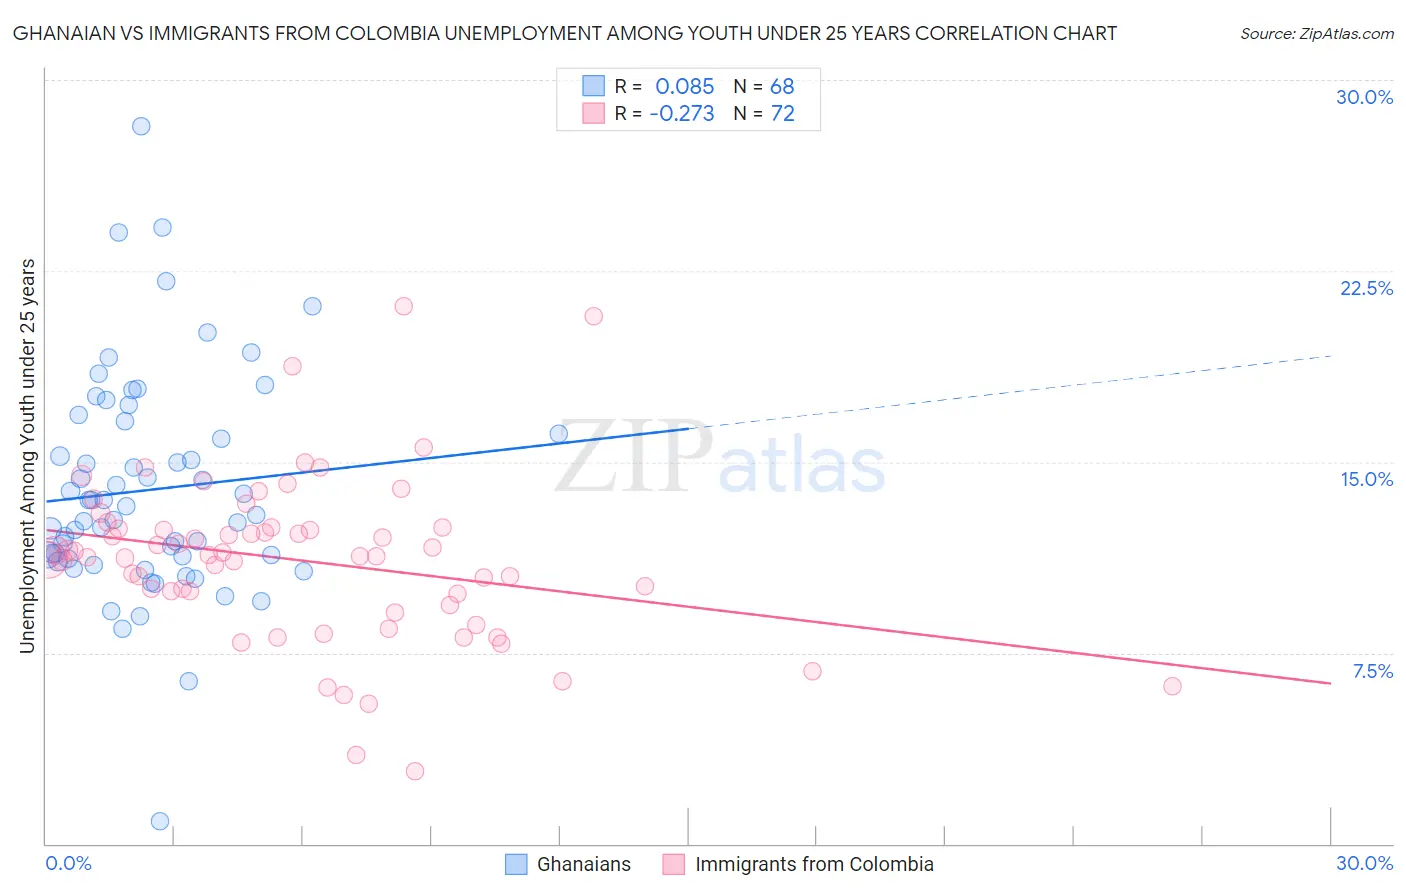
Ghanaian vs Immigrants from Colombia Unemployment Among Youth under 25 years Correlation Chart
The statistical analysis conducted on geographies consisting of 190,112,993 people shows a slight positive correlation between the proportion of Ghanaians and unemployment rate among youth under the age of 25 in the United States with a correlation coefficient (R) of 0.085 and weighted average of 13.3%. Similarly, the statistical analysis conducted on geographies consisting of 375,078,291 people shows a weak negative correlation between the proportion of Immigrants from Colombia and unemployment rate among youth under the age of 25 in the United States with a correlation coefficient (R) of -0.273 and weighted average of 11.8%, a difference of 13.1%.
Unemployment Among Youth under 25 years Correlation Summary
| Measurement | Ghanaian | Immigrants from Colombia |
| Minimum | 0.90% | 2.9% |
| Maximum | 28.2% | 21.1% |
| Range | 27.3% | 18.2% |
| Mean | 13.9% | 11.1% |
| Median | 13.1% | 11.3% |
| Interquartile 25% (IQ1) | 11.3% | 9.6% |
| Interquartile 75% (IQ3) | 16.3% | 12.4% |
| Interquartile Range (IQR) | 5.1% | 2.8% |
| Standard Deviation (Sample) | 4.4% | 3.3% |
| Standard Deviation (Population) | 4.3% | 3.2% |
Similar Demographics by Unemployment Among Youth under 25 years
Demographics Similar to Ghanaians by Unemployment Among Youth under 25 years
In terms of unemployment among youth under 25 years, the demographic groups most similar to Ghanaians are Blackfeet (13.3%, a difference of 0.050%), Ecuadorian (13.3%, a difference of 0.060%), Lumbee (13.3%, a difference of 0.090%), Immigrants from Cameroon (13.3%, a difference of 0.10%), and Sierra Leonean (13.3%, a difference of 0.12%).
| Demographics | Rating | Rank | Unemployment Among Youth under 25 years |
| Africans | 0.0 /100 | #278 | Tragic 13.2% |
| Cajuns | 0.0 /100 | #279 | Tragic 13.2% |
| Ute | 0.0 /100 | #280 | Tragic 13.3% |
| Armenians | 0.0 /100 | #281 | Tragic 13.3% |
| Sierra Leoneans | 0.0 /100 | #282 | Tragic 13.3% |
| Immigrants | Cameroon | 0.0 /100 | #283 | Tragic 13.3% |
| Lumbee | 0.0 /100 | #284 | Tragic 13.3% |
| Ghanaians | 0.0 /100 | #285 | Tragic 13.3% |
| Blackfeet | 0.0 /100 | #286 | Tragic 13.3% |
| Ecuadorians | 0.0 /100 | #287 | Tragic 13.3% |
| Immigrants | Western Africa | 0.0 /100 | #288 | Tragic 13.4% |
| Immigrants | Ghana | 0.0 /100 | #289 | Tragic 13.4% |
| Immigrants | Ecuador | 0.0 /100 | #290 | Tragic 13.4% |
| Apache | 0.0 /100 | #291 | Tragic 13.5% |
| Central American Indians | 0.0 /100 | #292 | Tragic 13.5% |
Demographics Similar to Immigrants from Colombia by Unemployment Among Youth under 25 years
In terms of unemployment among youth under 25 years, the demographic groups most similar to Immigrants from Colombia are Cherokee (11.8%, a difference of 0.020%), Korean (11.7%, a difference of 0.17%), Arab (11.8%, a difference of 0.19%), Egyptian (11.7%, a difference of 0.33%), and Palestinian (11.8%, a difference of 0.34%).
| Demographics | Rating | Rank | Unemployment Among Youth under 25 years |
| Immigrants | Russia | 28.5 /100 | #192 | Fair 11.7% |
| Seminole | 27.9 /100 | #193 | Fair 11.7% |
| Immigrants | Sri Lanka | 27.8 /100 | #194 | Fair 11.7% |
| Paraguayans | 27.2 /100 | #195 | Fair 11.7% |
| Egyptians | 26.9 /100 | #196 | Fair 11.7% |
| Koreans | 23.9 /100 | #197 | Fair 11.7% |
| Cherokee | 21.2 /100 | #198 | Fair 11.8% |
| Immigrants | Colombia | 20.9 /100 | #199 | Fair 11.8% |
| Arabs | 18.0 /100 | #200 | Poor 11.8% |
| Palestinians | 16.0 /100 | #201 | Poor 11.8% |
| Marshallese | 15.8 /100 | #202 | Poor 11.8% |
| Immigrants | Peru | 15.3 /100 | #203 | Poor 11.8% |
| Immigrants | Costa Rica | 15.2 /100 | #204 | Poor 11.8% |
| Peruvians | 14.0 /100 | #205 | Poor 11.8% |
| Immigrants | Pakistan | 12.6 /100 | #206 | Poor 11.8% |