German Russian vs Immigrants from Venezuela Unemployment Among Ages 16 to 19 years
COMPARE
German Russian
Immigrants from Venezuela
Unemployment Among Ages 16 to 19 years
Unemployment Among Ages 16 to 19 years Comparison
German Russians
Immigrants from Venezuela
17.2%
UNEMPLOYMENT AMONG AGES 16 TO 19 YEARS
84.1/ 100
METRIC RATING
131st/ 347
METRIC RANK
16.9%
UNEMPLOYMENT AMONG AGES 16 TO 19 YEARS
95.3/ 100
METRIC RATING
97th/ 347
METRIC RANK
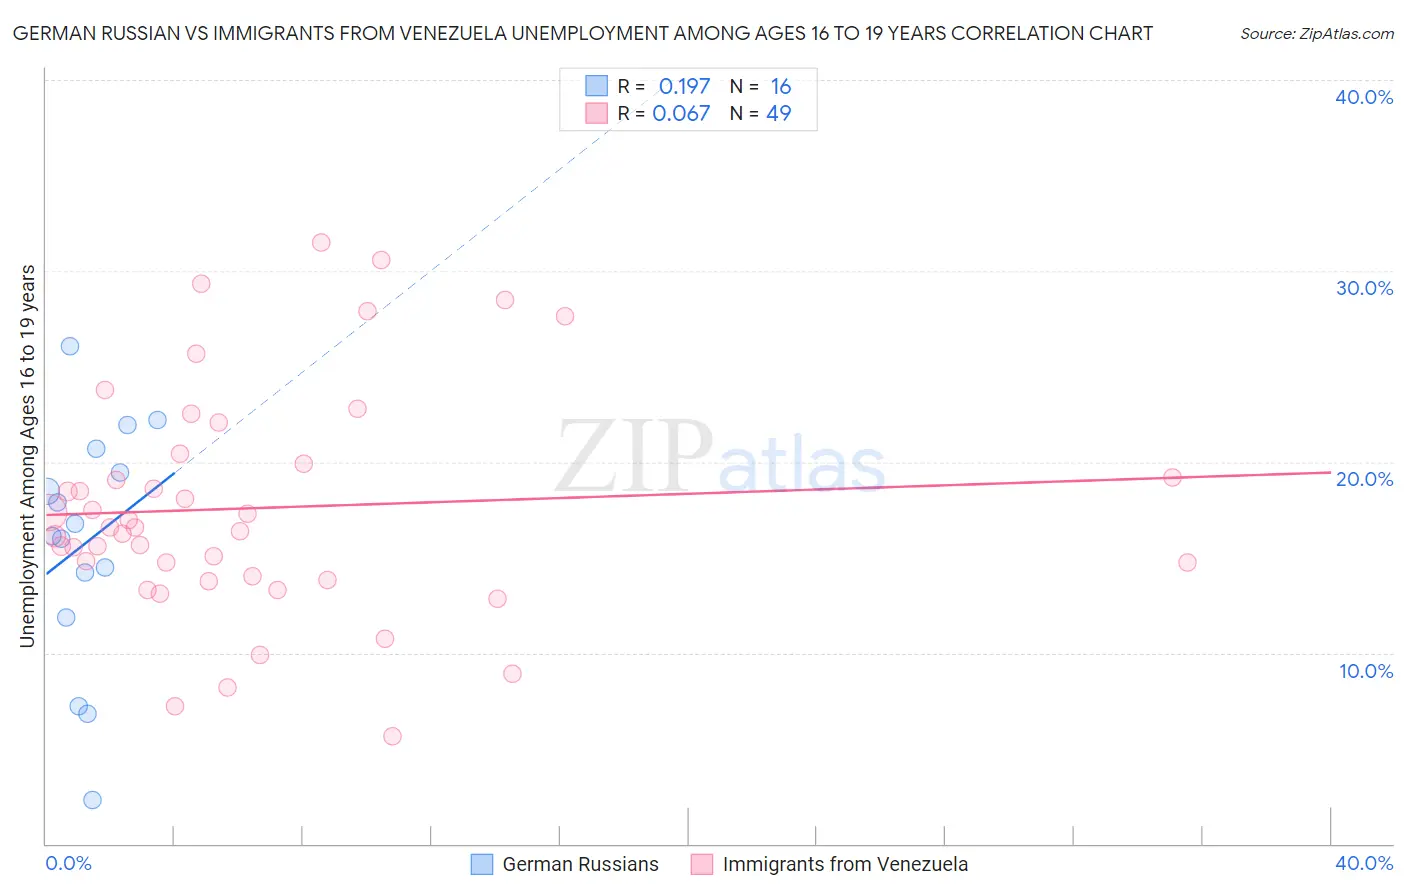
German Russian vs Immigrants from Venezuela Unemployment Among Ages 16 to 19 years Correlation Chart
The statistical analysis conducted on geographies consisting of 94,923,342 people shows a poor positive correlation between the proportion of German Russians and unemployment rate among population between the ages 16 and 19 in the United States with a correlation coefficient (R) of 0.197 and weighted average of 17.2%. Similarly, the statistical analysis conducted on geographies consisting of 277,495,072 people shows a slight positive correlation between the proportion of Immigrants from Venezuela and unemployment rate among population between the ages 16 and 19 in the United States with a correlation coefficient (R) of 0.067 and weighted average of 16.9%, a difference of 1.7%.
Unemployment Among Ages 16 to 19 years Correlation Summary
| Measurement | German Russian | Immigrants from Venezuela |
| Minimum | 2.3% | 5.6% |
| Maximum | 26.1% | 31.5% |
| Range | 23.8% | 25.9% |
| Mean | 15.8% | 17.6% |
| Median | 16.5% | 16.6% |
| Interquartile 25% (IQ1) | 13.0% | 13.9% |
| Interquartile 75% (IQ3) | 20.1% | 20.2% |
| Interquartile Range (IQR) | 7.0% | 6.2% |
| Standard Deviation (Sample) | 6.3% | 6.0% |
| Standard Deviation (Population) | 6.1% | 5.9% |
Similar Demographics by Unemployment Among Ages 16 to 19 years
Demographics Similar to German Russians by Unemployment Among Ages 16 to 19 years
In terms of unemployment among ages 16 to 19 years, the demographic groups most similar to German Russians are Arab (17.2%, a difference of 0.020%), Laotian (17.2%, a difference of 0.020%), Potawatomi (17.2%, a difference of 0.030%), Samoan (17.2%, a difference of 0.030%), and Immigrants from Indonesia (17.2%, a difference of 0.050%).
| Demographics | Rating | Rank | Unemployment Among Ages 16 to 19 years |
| Syrians | 88.6 /100 | #124 | Excellent 17.1% |
| Immigrants | Germany | 87.7 /100 | #125 | Excellent 17.2% |
| Immigrants | Bolivia | 86.7 /100 | #126 | Excellent 17.2% |
| Pakistanis | 85.8 /100 | #127 | Excellent 17.2% |
| Australians | 85.6 /100 | #128 | Excellent 17.2% |
| Creek | 85.5 /100 | #129 | Excellent 17.2% |
| Immigrants | Indonesia | 84.7 /100 | #130 | Excellent 17.2% |
| German Russians | 84.1 /100 | #131 | Excellent 17.2% |
| Arabs | 83.9 /100 | #132 | Excellent 17.2% |
| Laotians | 83.9 /100 | #133 | Excellent 17.2% |
| Potawatomi | 83.8 /100 | #134 | Excellent 17.2% |
| Samoans | 83.7 /100 | #135 | Excellent 17.2% |
| Immigrants | Oceania | 83.1 /100 | #136 | Excellent 17.2% |
| Immigrants | Malaysia | 82.8 /100 | #137 | Excellent 17.2% |
| Bolivians | 81.9 /100 | #138 | Excellent 17.3% |
Demographics Similar to Immigrants from Venezuela by Unemployment Among Ages 16 to 19 years
In terms of unemployment among ages 16 to 19 years, the demographic groups most similar to Immigrants from Venezuela are Ottawa (16.9%, a difference of 0.030%), Mongolian (16.9%, a difference of 0.060%), Burmese (17.0%, a difference of 0.10%), Immigrants from Lithuania (17.0%, a difference of 0.12%), and Bangladeshi (16.9%, a difference of 0.13%).
| Demographics | Rating | Rank | Unemployment Among Ages 16 to 19 years |
| Asians | 96.6 /100 | #90 | Exceptional 16.9% |
| Cambodians | 96.3 /100 | #91 | Exceptional 16.9% |
| South Africans | 95.9 /100 | #92 | Exceptional 16.9% |
| Cubans | 95.8 /100 | #93 | Exceptional 16.9% |
| Bangladeshis | 95.8 /100 | #94 | Exceptional 16.9% |
| Mongolians | 95.6 /100 | #95 | Exceptional 16.9% |
| Ottawa | 95.4 /100 | #96 | Exceptional 16.9% |
| Immigrants | Venezuela | 95.3 /100 | #97 | Exceptional 16.9% |
| Burmese | 95.0 /100 | #98 | Exceptional 17.0% |
| Immigrants | Lithuania | 94.9 /100 | #99 | Exceptional 17.0% |
| Immigrants | Thailand | 94.7 /100 | #100 | Exceptional 17.0% |
| Immigrants | Saudi Arabia | 94.7 /100 | #101 | Exceptional 17.0% |
| Immigrants | Pakistan | 94.6 /100 | #102 | Exceptional 17.0% |
| Palestinians | 94.6 /100 | #103 | Exceptional 17.0% |
| Italians | 94.5 /100 | #104 | Exceptional 17.0% |