German Russian vs Guatemalan Unemployment Among Ages 55 to 59 years
COMPARE
German Russian
Guatemalan
Unemployment Among Ages 55 to 59 years
Unemployment Among Ages 55 to 59 years Comparison
German Russians
Guatemalans
4.5%
UNEMPLOYMENT AMONG AGES 55 TO 59 YEARS
99.8/ 100
METRIC RATING
47th/ 347
METRIC RANK
5.3%
UNEMPLOYMENT AMONG AGES 55 TO 59 YEARS
0.0/ 100
METRIC RATING
281st/ 347
METRIC RANK
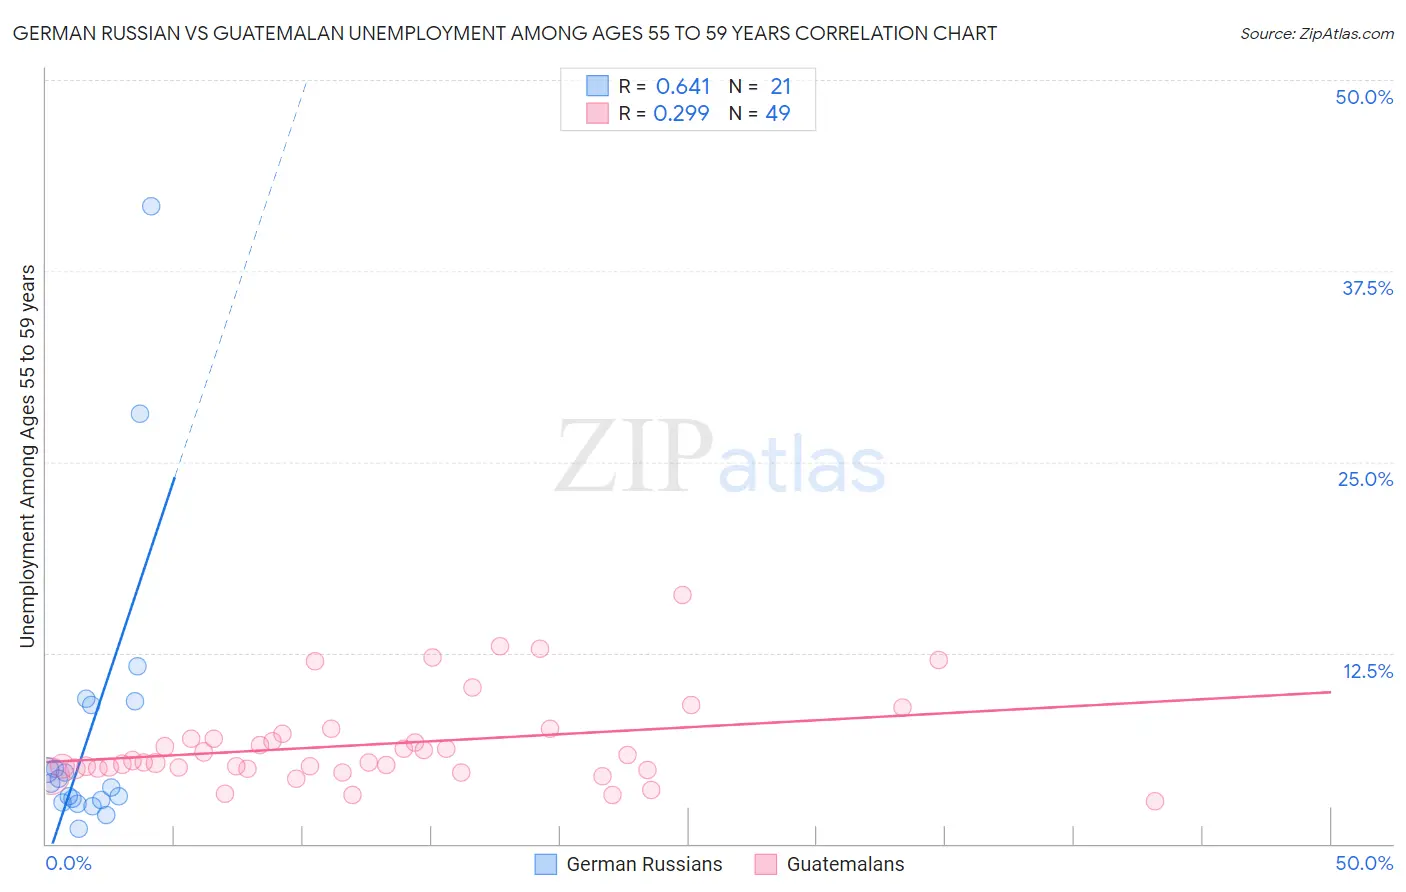
German Russian vs Guatemalan Unemployment Among Ages 55 to 59 years Correlation Chart
The statistical analysis conducted on geographies consisting of 93,561,561 people shows a significant positive correlation between the proportion of German Russians and unemployment rate among population between the ages 55 and 59 in the United States with a correlation coefficient (R) of 0.641 and weighted average of 4.5%. Similarly, the statistical analysis conducted on geographies consisting of 380,003,444 people shows a weak positive correlation between the proportion of Guatemalans and unemployment rate among population between the ages 55 and 59 in the United States with a correlation coefficient (R) of 0.299 and weighted average of 5.3%, a difference of 16.4%.
Unemployment Among Ages 55 to 59 years Correlation Summary
| Measurement | German Russian | Guatemalan |
| Minimum | 0.96% | 2.8% |
| Maximum | 41.7% | 16.3% |
| Range | 40.7% | 13.5% |
| Mean | 7.5% | 6.5% |
| Median | 4.0% | 5.3% |
| Interquartile 25% (IQ1) | 2.8% | 4.9% |
| Interquartile 75% (IQ3) | 9.2% | 7.0% |
| Interquartile Range (IQR) | 6.4% | 2.1% |
| Standard Deviation (Sample) | 9.8% | 2.9% |
| Standard Deviation (Population) | 9.5% | 2.9% |
Similar Demographics by Unemployment Among Ages 55 to 59 years
Demographics Similar to German Russians by Unemployment Among Ages 55 to 59 years
In terms of unemployment among ages 55 to 59 years, the demographic groups most similar to German Russians are Immigrants from Zaire (4.5%, a difference of 0.060%), British (4.5%, a difference of 0.080%), Immigrants from Korea (4.5%, a difference of 0.15%), European (4.5%, a difference of 0.15%), and Immigrants from Kuwait (4.5%, a difference of 0.19%).
| Demographics | Rating | Rank | Unemployment Among Ages 55 to 59 years |
| Swiss | 99.8 /100 | #40 | Exceptional 4.5% |
| Luxembourgers | 99.8 /100 | #41 | Exceptional 4.5% |
| Immigrants | Kuwait | 99.8 /100 | #42 | Exceptional 4.5% |
| Immigrants | Korea | 99.8 /100 | #43 | Exceptional 4.5% |
| Europeans | 99.8 /100 | #44 | Exceptional 4.5% |
| British | 99.8 /100 | #45 | Exceptional 4.5% |
| Immigrants | Zaire | 99.8 /100 | #46 | Exceptional 4.5% |
| German Russians | 99.8 /100 | #47 | Exceptional 4.5% |
| Immigrants | Moldova | 99.7 /100 | #48 | Exceptional 4.5% |
| Immigrants | Saudi Arabia | 99.7 /100 | #49 | Exceptional 4.5% |
| Immigrants | Pakistan | 99.7 /100 | #50 | Exceptional 4.5% |
| Maltese | 99.7 /100 | #51 | Exceptional 4.5% |
| Scottish | 99.7 /100 | #52 | Exceptional 4.5% |
| Immigrants | Middle Africa | 99.7 /100 | #53 | Exceptional 4.5% |
| Burmese | 99.7 /100 | #54 | Exceptional 4.5% |
Demographics Similar to Guatemalans by Unemployment Among Ages 55 to 59 years
In terms of unemployment among ages 55 to 59 years, the demographic groups most similar to Guatemalans are Immigrants from Uzbekistan (5.3%, a difference of 0.15%), Immigrants from Trinidad and Tobago (5.3%, a difference of 0.27%), Apache (5.3%, a difference of 0.30%), Ghanaian (5.3%, a difference of 0.34%), and Alsatian (5.2%, a difference of 0.36%).
| Demographics | Rating | Rank | Unemployment Among Ages 55 to 59 years |
| Mexican American Indians | 0.0 /100 | #274 | Tragic 5.2% |
| Israelis | 0.0 /100 | #275 | Tragic 5.2% |
| West Indians | 0.0 /100 | #276 | Tragic 5.2% |
| Immigrants | Latin America | 0.0 /100 | #277 | Tragic 5.2% |
| Immigrants | Barbados | 0.0 /100 | #278 | Tragic 5.2% |
| Alsatians | 0.0 /100 | #279 | Tragic 5.2% |
| Immigrants | Uzbekistan | 0.0 /100 | #280 | Tragic 5.3% |
| Guatemalans | 0.0 /100 | #281 | Tragic 5.3% |
| Immigrants | Trinidad and Tobago | 0.0 /100 | #282 | Tragic 5.3% |
| Apache | 0.0 /100 | #283 | Tragic 5.3% |
| Ghanaians | 0.0 /100 | #284 | Tragic 5.3% |
| Armenians | 0.0 /100 | #285 | Tragic 5.3% |
| Immigrants | Ghana | 0.0 /100 | #286 | Tragic 5.3% |
| Immigrants | Guatemala | 0.0 /100 | #287 | Tragic 5.3% |
| Immigrants | Israel | 0.0 /100 | #288 | Tragic 5.3% |